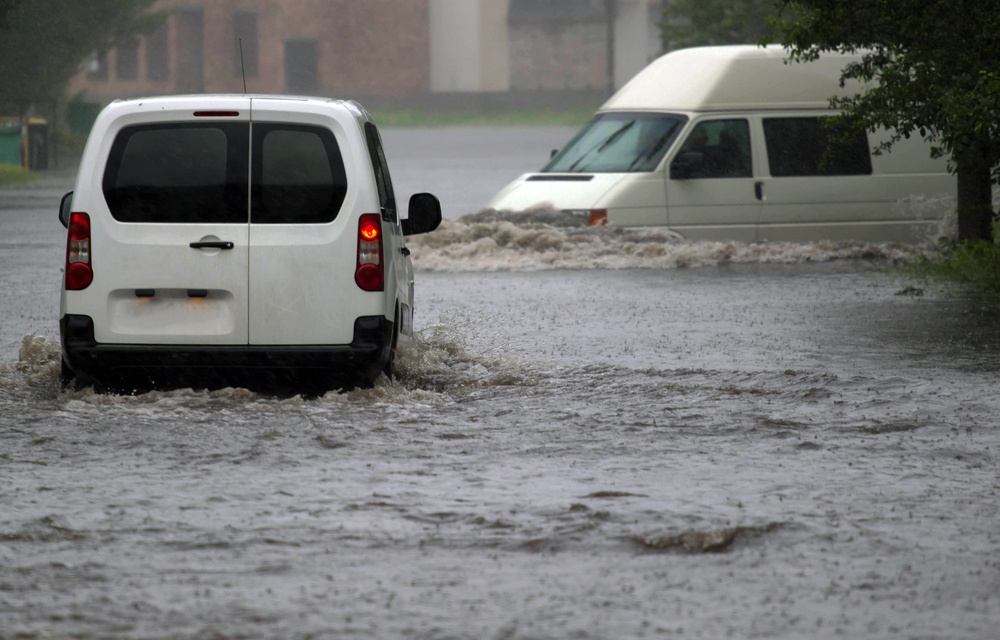

With the massive flooding in Houston from Hurricane Harvey, we're re-publishing this very relevant post from 2016 by Steve Poppe about how local governments can apply FAIR modeling to plan for megastorms.
Silicon Valley Braces for a Megastorm
The current drought notwithstanding, the San Francisco Bay Area has been warned that it is not prepared for a once-in-a-century megastorm.
A 2015 study [1] estimates damage of $10 billion from a storm that could occur once in 100 or 200 years. It’s not scare-mongering: in the winter of 1861-62, it rained 28 of 30 days, resulting in 34 inches of rainfall in San Francisco Bay. Flooding was widespread as far away as Sacramento.
The report urges action on 20-odd recommendations to improve flood mitigation infrastructure, emergency preparedness, contingency planning, and local agency coordination.
Although the report makes no specific recommendations for spending, the citizen naturally wonders how much should be spent, on what, and how it compares to what is actually being done.
To get some insight into these questions, I did some very simple modeling of the annual loss expectancy using the FAIR framework [2].
The Model
The report states the single event loss expectancy as a single number. The underlying analyses of some components give some ranges. Other cases stop with a statement of “significant uncertainty.” As risk analysts, we are not satisfied with a single number. We want the range and the probabilities. FAIR is the perfect instrument.
Almost all the necessary data can be found in the report. The scenario is predicated on a storm that could occur once in 100 or 200 years, a “megastorm.” The annual rate of occurrence and the magnitude of such a storm is based on good data: historical records, hydrographic models, and paleohydrological studies.
There are also good empirical and analytical sources for loss estimates. The report draws on many sources for four loss types:
- Damage to structures
- Damage to contents of structures
- Delays in transportation
- Interruptions of electrical service
Many other economic consequences of a storm are ignored, such as the impact on state domestic product. The focus is on damage that could be directly mitigated by better flood preparedness. (The report also excludes consideration of even bigger and rarer storms, such as an ARkStorm, an interesting topic in itself. [3]).
My model considers only damage estimates for San Mateo county, where I live. For structural damage, the report gives a single-occurrence estimate of $680M, and for contents of structures $418M. These are both about 10% of the nine-county Bay Area total. The report gives no breakdown by county for transportation and electricity, so I applied a 10% allocator to the nine-county Bay Area total to get $16M and $13M for my county’s share. The total single loss expectancy (SLE) is $1,127M for San Mateo County.
I used some heuristics to get a probability distribution for the single loss expectancy. I believe expert estimates can be as much as 50% high or low compared to an actual single-occurrence loss, so applying this to the SLE of $1,127 M gives a range of $560M to $1,690M. I chose a PERT probability distribution with a confidence level of 4. These assumptions imply a beta distribution with parameters 3 and 3, and a 90% confidence interval of $670M, $1020M. (The beta distribution is what simulation packages tend to supply, but I find the PERT distribution more intuitive.)
For the annual rate of occurrence, ARO, I also chose a PERT distribution with a range of 1/200 years to 1/100 years, and a confidence level of 4. For the most likely value I used the geometric mean, about 0.007 or once in 141 years.
The figure shows the simple model structure, built in the spirit of FAIR. I ran a Monte Carlo simulation of 1000 replications. Each replication generated random variables for the annual rate of occurrence and the single loss expectancy using the probability distributions described above. The simulation results in a histogram of annual loss expectancies shown in the chart.

Here are some summary statistics for the simulated annual loss expectancies for San Mateo County:
5%ile $5.3M
50%ile $7.9M
95%ile $11.4M
Mean $8.1M
standard deviation $1.8M
Budgeting for Megastorm Preparedness
Do these results mean that the citizens of San Mateo County should consider taxing themselves for an additional $8M per year to invest in flood preparedness? How much should the county spend?
It is neither possible nor necessary to reduce the SLE to zero. How much would the county have to spend to reduce the ALE by 50% to $4M? The county should only invest in projects expected to avoid losses significantly more than they cost. The USGS cites evidence [3, p. 157] that “every dollar invested in mitigation saved four dollars in potential losses” from floods. If the county selects projects with a 4:1 loss mitigation ratio or better, then we should consider investing at the rate of $2M a year for a 50% reduction of ALE.
How does this compare to what the county is actually spending? Remarkably, the actual budget for San Mateo County for capital projects to improve flood preparedness is $2M for FY 2015-16 and a recommended $1.5M for FY 2016-17. It seems the county has it about right, assuming they choose good projects.
Conclusions
This simple analysis illustrates yet again the insight that can be gained from a simple model. Hubbard [4, p.11] tells how Enrico Fermi favored simple methods to estimate imponderable quantities, like the number of piano tuners in Chicago or the yield of the first atomic bomb. The model here is in the spirit of Fermi decomposition (“break it down to things you know or can find out”) and specifically in the framework of the Factor Analysis of Information Risk (FAIR). As we see here, FAIR is useful far outside of cyber security and applicable for a variety of operational risks. Maybe Factor Analysis of Disaster Risk, FADIR?
What FAIR adds to a Fermi decomposition is an explicit and easy way to handle uncertainties, not only probabilities of whether or not something will happen, but also a huge uncertainty in the estimates of loss magnitudes if it does happen. It gives us a way to use “expert” estimates that are surely overly precise, but while retaining our skepticism. This shows the FAIR approach can unlock scads of value in the numerous reports of expert committees that are overloaded with absurdly precise numbers.
Ultimately, what a decision maker needs to know is not just what the risk is if she does or does not do something, but how much to spend and on what to spend to manage that risk. It is especially problematic for the citizen to know whether the politicians are spending our tax money wisely. This model used public data to answer that question in a very targeted way.
Researching this topic uncovered a very handy rule of thumb for disaster preparedness. The US Geological Survey found in a summary that the loss avoidance ratio, what we might call the return on investment for disaster preparedness, is 4:1, presumably for well-chosen projects. That kind of thinking could be extremely useful to CISOs, CIOs, and CFOs.
A Call to Action
Returning to the field of cyber security, for which FAIR was designed, it would be hugely beneficial to the community to have reliable reports of the returns on security investments (ROSIs) realized by organizations from actual security investments. What if it turned out that the ROSI was 3000% for good password hygiene, 500% for patching, and -90% for motion-activated lights in the data center? Your security budget may be enough now, if you only had the numbers. As it stands now, each organization has to do its own analysis – or depend on the selling of fear, uncertainty, and doubt.
We are told by standards bodies to manage by risk rather than by compliance checklist. To do that, we need the data.
References
[1] Surviving the Storm, March 2015, Bay Area Council Economic Institute
[2] The FAIR standard is at https://www2.opengroup.org/ogsys/catalog/C13G
[3] Overview of the ARkStorm Scenario, US Geological Survey, Open File Report 2010-1312
[4] How to Measure Anything, D. Hubbard, 2d ed.
Acknowledgment
This study used a free perpetual license of the Analytica modeling tool (v. 4.5) from Lumina, http://lumina.com/.
New 3-20-16, rev. 3-23-16, 5-16-16


