In Part 1 of this series I shared that most organizations seem to, almost by default, characterize themselves as having a “Medium-Low” risk appetite. I also drew a distinction between the two decision-making use-cases for risk appetite — managing the “aggregate” level of organization risk, versus managing the per-scenario level of risk. Within this post I’ll focus on the challenges and limitations of using a single point value as a measure of risk, particularly when dealing with risk appetite.
What’s it really mean?
Because risk measurement is always an estimate of future loss (its frequency and magnitude), there is inevitably some amount of uncertainty. In other words, we don’t know precisely how often a loss event will occur (or exactly when), nor do we know precisely how much loss will materialize from each of those events. Using FAIR (at least when using it to perform quantitative analyses), we can faithfully represent that uncertainty by using distributions. Representing risk as either a discrete quantitative value, or as a point along a qualitative or ordinal continuum, fails to capture or represent that uncertainty.
For example, let’s say that we’re an executive faced with making a decision about whether a particular risk scenario exceeds an organization’s risk appetite (at the per-scenario level). Furthermore, let’s say that the distribution below represents a quantitative measurement of risk for this scenario.
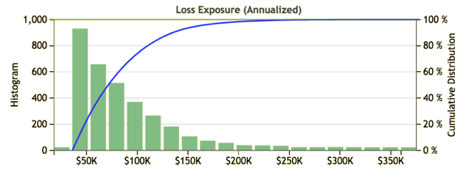
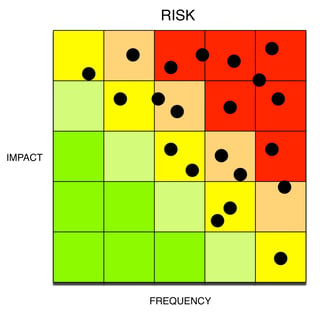
If all we’re given as a risk measurement for this scenario is “it’s Medium-Low risk” (as in the heat map below), we have no way of knowing whether that represents the best-case, worst-case, or something in-between. We also don’t know how much uncertainty there is in the measurement or, in this case, that there is a fairly long tail. Our decision is woefully uninformed.
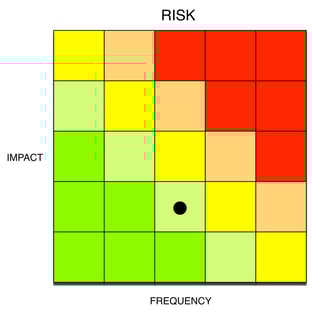
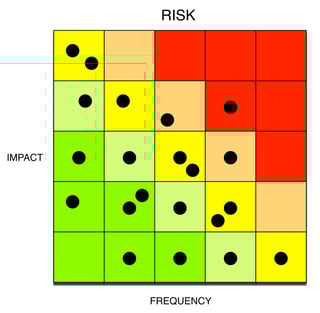
For the question of aggregate risk, simply extrapolate this incomplete information across every one of the qualitative measurements in the heat map on the left (below), which might in fact look more like the heat map on the right if you were considering the tails.
A little bit better, but…
In order to partially mitigate this problem when using qualitative measurements, an organization must ensure that risk measurements are consistently performed. At a minimum, this requires that:
- Personnel performing the measurements are always using the same risk model, and that the model is well-developed (e.g., FAIR)
- A clear, unambiguous measurement scale is consistently used
- Personnel are qualified to do the measurements
In addition, discrete risk measurements (like “medium”) must be based on an organizationally agreed-upon standard such as:
- “All risk measurements will represent the expected worst-case level of risk” (or most likely level of risk, or whatever the organization decides to base its decisions on)
Of course this still has some obvious problems, including the fact that the level of uncertainty in measurements is unrepresented.
At the end of the day...
Given the above concerns, I’m pretty skeptical that many (or any?) organizations can reliably defend a claim that they are operating within their risk appetite if they’re using discrete risk measurements.
In the 3rd post of this series I’ll discuss some of the challenges associated with how organizations commonly use KRI’s for risk appetite. More to come...
Read more: