 In the first two posts of this series, I discussed questions regarding how to make estimates when data is sparse or missing altogether, and how to account for the fact that historical data may not perfectly reflect the future. In this post, I’ll walk through an example risk analysis that is challenged in both of those respects.
BTW — I’m going to keep this analysis very high level from a FAIR model perspective. Getting into the weeds isn’t necessary in order to illustrate how to deal with data-related challenges. Also, I apologize in advance for the length of this post. It often takes longer to write (and read) about these things than it does to actually perform them.
Read the first two posts in the series:
Rogue DBAs?
Let’s say we’re faced with the question, “How much risk is associated with the scenario where a rogue database administrator (DBA) runs off with sensitive customer information?” The question may stem from an audit finding related to a lack of database logging, or maybe the CEO asked the question after she attended a conference presentation where someone raised this as a concern. Regardless, we’re now faced with having to measure something that hasn’t happened to our organization yet (at least that we’re aware of).
Let’s talk frequency…
Let’s start the analysis by estimating how frequently we believe this event is likely to occur. If you read the first post in this series you’ll know that we start the estimation process with an absurd range — e.g., a frequency of between once every million years and a million times per year. In other words, we believe that a rogue DBA in our organization will run off with sensitive customer information at least once every million years, but no more than a million times a year. (Note that this range represents the number of attacks and not the number of stolen records.) Because this is an absurd estimate, we’re essentially 100% confident in its accuracy — i.e., that the true frequency will exist somewhere within this range.
With this as a starting point, we begin to narrow the range based on any data or logical rationale we can come up with. Some of the factors we might consider include:
- The number of DBAs with access to sensitive customer information (larger populations will increase the odds of a bad apple)
- The tenure and work/performance history of the DBAs
- Any controls that might be in play (e.g., logging, monitoring, data leakage protection, etc.)
- Any industry data that may exist
- Also, in this case (and in many cases) the absence of data is a form of data. In other words, because the organization has never experienced an event of this type, it would be hard to logically defend a frequency that’s very high. Yes, a rogue DBA might have run off with boatloads of sensitive customer data. Maybe multiple times. But if that’s the case, why hasn’t it come to light given that they’re almost certainly doing it to gain financially and/or hurt the organization? If the latter, then by definition we’d know about it when/if it occurred. If the former, then financial gain comes by selling the data or using the data themselves. In the case of financial gain, most PII is leveraged for identity theft and/or account fraud. If that was occurring to a significant number of customers, then it almost certainly would come to light. So, again, although it’s possible that such an event has occurred and we just don’t know about it, it would seem pretty unlikely, which makes it difficult to rationally defend a frequency value that’s very high.
Each time we narrow the range, we test our confidence using Douglas Hubbard’s equivalent bet method. The point at which we’re unable to choose between our range and the 90% chance of winning by spinning the wheel, we are by definition 90% confident in our range.
When I’ve analyzed this rogue DBA scenario within organizations, the typical final range is in the neighborhood of:
Minimum frequency: Once every 50 years
Maximum frequency: Once every 5 years
Obviously, this range isn’t highly precise, but that’s the point. When you have little to no data, your estimates need to reflect that fact. Still, this is significantly better than “I have no idea” and it enables you to leverage things like PERT (Program Evaluation and Review Technique) distributions and Monte Carlo functions to do real math.
But how much credence should we place on the fact that, historically, we haven’t had an incident of this type? Maybe our company is about to start layoffs, or maybe we’re about to double the size of our technology staff due to a merger. If there are factors that we believe need to be taken into account to reflect a potentially different future, then we can do so by adjusting our ranges up or down, as appropriate. When we do that however, we also need to document these considerations alongside the other rationale we’ve based our estimates on.
Let’s talk impact…
The frequency of rogue DBA events isn’t the only thing in question. Our hypothetical organization also doesn’t have any experience with the consequences of such an event. When faced with this situation, people will often simply default to the worst-case outcome — e.g., we’ll assume the bad actor ran off with every single customer record. You can do this, but there may be a catch. Were you thinking “worst-case outcome” when you were making your frequency estimates? If not, then you’ll need to go back and adjust your frequency estimates to reflect this very specific worst-case event, which may have a lower frequency. This is a mistake we run into frequently — where someone estimates frequency using a different mental model of the scenario than what they apply when estimating impact. The remedy is simple. Estimate impact first, then estimate frequency.
But let’s say that; a) we are going to keep it simple by assuming a worst-case event from a record loss perspective, and b) our frequency estimate was based on that worst-case assumption. Even now we face uncertainty about the impact:
- What percentage of the affected customers are likely to jump ship and take their business elsewhere? All of them? Highly unlikely.
- Will investors discount our stock price? If so, by how much and for how long?
- Will the cost of capital, or cyber insurance, rise? If so, by how much?
- Will the regulators or the cyber equivalent of ambulance-chasing-lawyers come after us with guns-a-blazing? If so, at what cost in terms of defense or settlements?
- Will the organization’s response be timely and project the right level of accountability and concern for the affected customers?
- How much will forensics cost?
- etc…
Each of these are ways in which impact can materialize, and each will have some amount of uncertainty that can be reflected through the calibrated estimate technique we've been discussing. Some data may exist from a handful of similar events that have occurred to other companies and been made public, but were those companies from the same industry or of the same size? In other words, how relevant is that historical data to our analysis?
Clearly, here again we have an opportunity to leverage calibrated estimates and ranges to generate values that are more likely to be accurate and that faithfully reflect the poor quality of our data. A key difference when it comes to impact though, is that the cyber risk professional typically should not be making these estimates. We simply aren’t qualified. Whenever possible, we need to get impact values from the business side of the house, or at the very least have them validate our estimates.
If you wince at the idea of having to elicit impact numbers from your business colleagues, you may be right. Those can be challenging conversations. Rarely have they had to even think about losses from a scenario like this. The good news is that there are ways to reduce the pain associated with this process. The bad news is that’s a topic much too big for this already lengthy blog post. Something to look forward to…
But, but, but…
I’ve heard the cries of protest in the past — “It’s all guessing!” or “Those are just opinions!” When I hear these criticisms two things immediately come to mind:
- Every measurement ever taken by a human being is an estimate. That laser range finder? Pretty precise, but still an estimate with some potential for variance and error. So the question isn’t whether a measurement is an estimate or not — they all are. The question is whether they; a) are accurate, b) reduce uncertainty, and c) are able to be arrived at within your time and resource constraints. See the first post in this series, or read one of Douglas Hubbard’s books if you’re not sure of what I’m talking about.
- The protester’s alternative is… what?
- A wet finger in the air and a proclamation of “medium”? Talk about “guessing” and “opinions”. By the way, what does “medium” mean again?
- Waiting until data exists? Until then I presume we just ignore the question. Sorry CEO, you’ll have to wait until we’ve had a statistically significant number of DBA compromises before we can talk to you about risk? Let me know how that conversation goes…
- Do absolutely everything in the cyber risk wishlist, all at the same time? As far as I’m aware, every organization has resource constraints, which means prioritization is necessary. And prioritization is invariably based on comparisons, which are invariably based on measurements. So back to my question — what is their alternative?
Another thing to keep in mind is that any protest regarding data quality applies equally to qualitative estimates. It just doesn’t feel that way because you aren’t forced to think very hard about what’s driving you to proclaim “medium”, which also lowers the odds of “medium” (or whatever) being accurate.
Until a realistic alternative comes to light I will continue to leverage well-established methods like calibrated estimation, using ranges and distributions to reflect uncertainty, and Monte Carlo functions to do the calculations. As a result, I will continue to feel comfortable defending my analyses. They won’t be perfect, but they’ll be logical and rational, and they will pragmatically reduce uncertainty.
Wrapping up
Hopefully it's clear by now that you can do credible and useful analysis of risk scenarios even when you have little or no data. But even when you have a lot of data for some of the variables in an analysis, you will very often have one or more variables where data is sparse. Therefore, being able to arrive at an accurate estimate in the absence of good data is crucial to effective risk analysis.
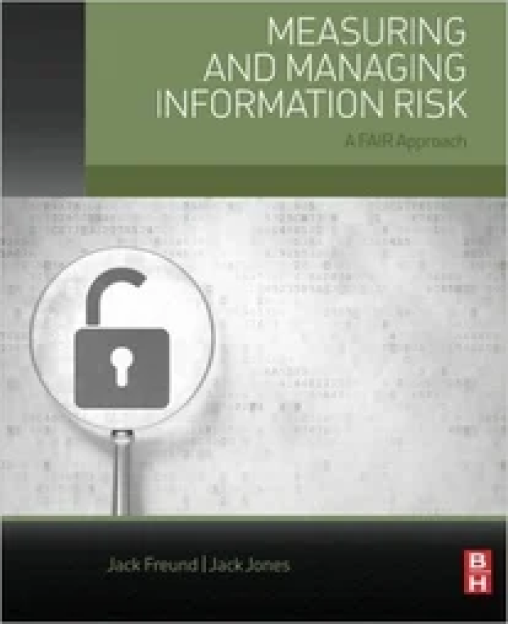
For those of you who want to see a complete analysis in detail, where each data element is evaluated and estimated, we excerpted just such an analysis from chapter 8 of my book Measuring and Managing Risk: A FAIR Approach. It's available on the FAIR Institute member resources page.


