I just wrapped an engagement helping a really great customer identify their top ten risks. Talk about commitment: They organized a book club where members of Information Security, Privacy and Audit were actively studying the FAIR book, Measuring and Managing Information Risk.
At the last club meeting, somebody said “I love the FAIR model and risk quantification. But how do I apply this to the risks that face me and my department?”
My answer: mapping.
…to a risk scenario.
Let me show you how this worked with a scenario we analyzed as part of this engagement:
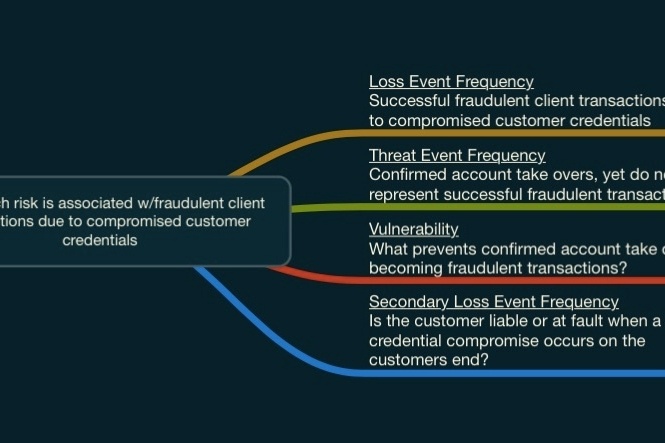
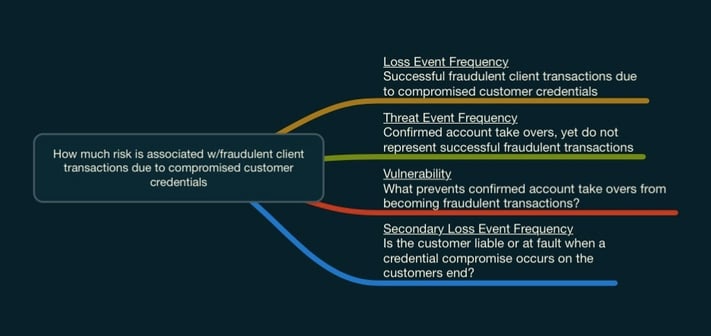
“How much risk is associated with compromised customer credentials leading to fraudulent transactions?”
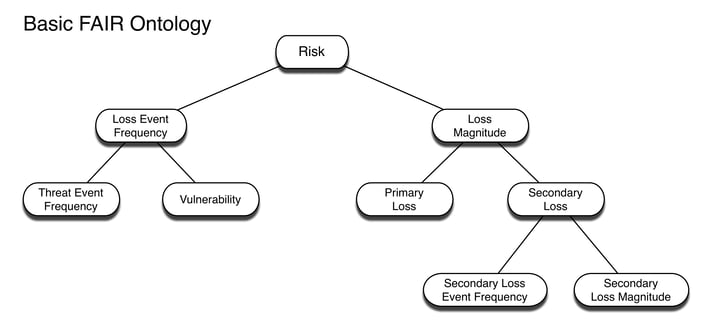
So let’s start mapping, starting with the left side of the ontology:
Loss Event Frequency
In this scenario, what data would represent the Loss Event Frequency? As we have a well-scoped analysis, not to toot my own horn, it’s pretty obvious:
Loss Event Frequency would be how many times per year a successful fraudulent transaction occurs due to compromised customer credentials.
Because we often want to show the efficacy of a control, we derive the Loss Event Frequency from Threat Event Frequency and Vulnerability.
Threat Event Frequency
With that in mind, what would represent the number of attempted compromises, or our Threat Event Frequency? If Loss Event Frequency represents the number of successful fraudulent transactions, then:
Threat Event Frequency would need to be the number of times accounts are taken over, yet do not result in successful transactions.
Vulnerability
Now for one of our key control areas…
What prevents those Threat Events from becoming Loss Events, in other words, our Vulnerability?
In this scenario, it represented the alerting and wire recall processes of the customer’s Fraud department.
Secondary Loss Event Frequency
Moving to the right side of the ontology, the driver of the other nodes is Secondary Loss Event Frequency. And the question is, when there is a fraudulent transaction due to compromised customer credentials…
What percent of the time do we anticipate adverse impacts from Secondary Stakeholders?
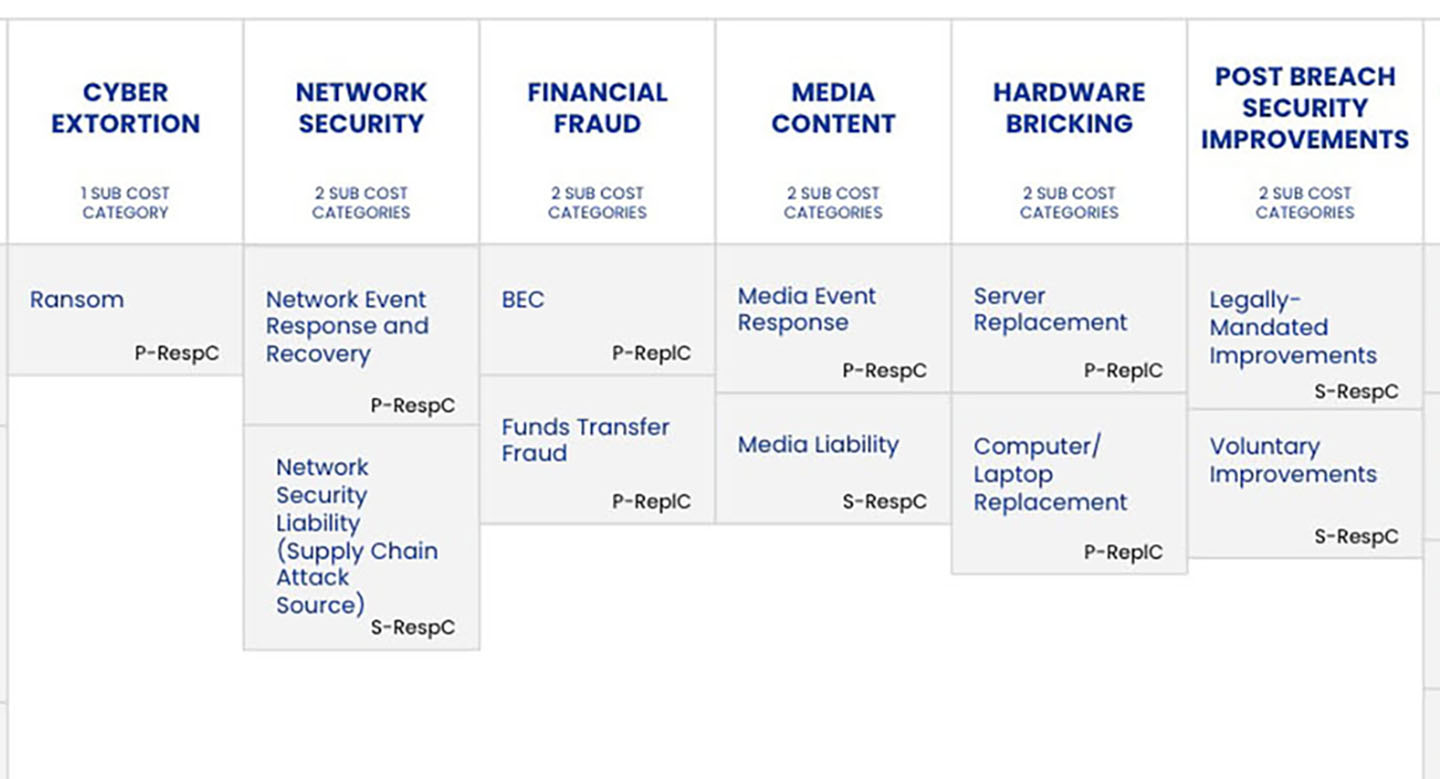
We use mind mapping software to think through risk scenarios. Here’s how it mapped out:
And the answer is…
When we considered that the compromise occurred on the customer’s end, as well as all of the efforts the Fraud department makes in an attempt to get the money back, this impact was relatively small.
As you can see, by assigning those core nodes of the ontology to the scenario we’re analyzing, we know exactly what the Loss Event is for this specific scenario, which is absolutely critical to scoping any analysis, as well as what information we need to go hunt down in order to quantify this scenario.
Initially, this process can be a little challenging to complete. It’s forcing you to logically think through the problem, probably way more than you’ve done previously. Yet I will say, the more of these that you do, the easier they get. For me, solving this problem is half the fun. I hope it’s the same for you.