


 Some of you may recall a series of posts I wrote on this topic last year. In the third post of that series I said I’d write another post that lays the foundation for dealing with risk appetite more effectively. Well, here we are a year later and I’m finally going to fulfill that promise. Hopefully, you’ll find the wait worthwhile.
In the first post of the series I pointed out that there are two broad categories of decisions where risk appetite can/should play a role. The first is the more tactical variety, where you’re faced with a risk analysis result, audit finding, policy exception request, zero-day vulnerability, etc., and the organization needs to decide how aggressively to treat it — i.e., its priority. The second decision category is more strategic, where the question is whether the aggregate exposure of the organization is acceptable or not. Clearly, the two are related, but we’ll get into that another time. For now let’s focus on the first, more tactical, category.
It’s not one clear bright line
There’s a common perception that risk appetite should be a single discrete value, as in “Our risk appetite is $10M of annualized loss exposure.” At an aggregate level, that approach is useful, but when it comes to the more tactical risk decisions I believe there’s a more practical approach for many organizations.
Let’s create a scale that describes different levels of aggressiveness for responding to a risk-related concern:
|
Response |
|
All hands on deck — don’t plan to go home until the situation is improved |
|
Begin work now — adjust existing priorities |
|
Build it into the schedule |
|
Add it to the list of things to do as resources become available |
|
Don’t forget about it, but don’t make any plans to resolve it |
These are just illustrative examples. You can, of course, word these any way you like, add or subtract layers, etc. Regardless, these should describe how the organization will respond to risk-related concerns.
Now let’s add a qualitative risk label to each response:
|
Risk Label |
Response |
|
Very High |
All hands on deck — don’t plan to go home until the situation improves |
|
High |
Begin work now — adjust existing priorities |
|
Medium |
Build it into the schedule |
|
Low |
Add it to the list of things to do as resources become available |
|
Very Low |
Don’t forget about it, but don’t make any plans to resolve it |
With this change, the table associates risk labels with organizational expectations for how each level of risk should be treated. Those that warrant an all hands on deck response are referred to as Very High risk. If a concern (e.g., an audit finding or zero-day vulnerability) doesn’t warrant that level of response, then it wouldn’t be labeled Very High risk — ever. This can be used as a practical litmus test (or filter) when risk-related concerns are raised because the timing and resource-related response factors inherently force an organization to think more critically about the risk ratings it uses. If something is labeled High risk but has been pushed to the back burner, either it was mislabeled or there should be very clear reasoning behind the decision to de-prioritize, and that decision would need to be made at the right level of authority. More on this in a moment.
At this point though, the table still isn’t explicitly linked to loss exposure or risk appetite, so let’s add another column, for annualized loss exposure (ALE):
|
Risk Label |
ALE Range |
Response |
|
Very High |
> $1M |
All hands on deck — don’t plan to go home until the situation improves |
|
High |
$100k ->$1M |
Begin work now — adjust existing priorities |
|
Medium |
$10k -> $100k |
Build it into the schedule |
|
Low |
$1k -> $10k |
Add it to the list of things to do as resources become available |
|
Very Low |
< $1k |
Don’t forget about it, but don’t make any plans to resolve it |
But perhaps your organization hasn’t begun using economic expressions of risk like ALE. No worries — use whatever risk level descriptions your organization has settled on. Most importantly, use descriptions/ranges that management agrees warrants each level of response.
It’s relative
Some of you may have looked at the ranges in the table above and recognized them as either too high or too low for your organization. Indeed. A company with revenue in the billions of dollars is almost certainly going to use different ranges than an organization with revenue under a million. Likewise, perhaps your enterprise is large and complex, with affiliates or subsidiaries of different sizes. In that case, you might need to define a set of ranges for the enterprise, and different ranges for these smaller organizations. Regardless, the table needs to reflect the organization’s capacity for loss, which is a key factor in risk appetite.
Are there organizational references that can be used to help set these ranges? Sometimes. Perhaps another risk group within the organization has already defined ranges like these for their problem space (e.g., operational or credit risk). It’s great when this is the case, because those ranges probably already have credibility with stakeholders. There may be other useful references to turn to as well, like some percentage of market cap, annual or quarterly revenue, or profit. If your organization has an enterprise risk management group, I’d suggest picking their brains on this question. Internal audit might also be able to provide some insight.
If there aren’t existing internal references or SME’s, very often your best bet is to define a set of ranges using your best judgment as a conversation starter, and then ask the executives to help you adjust them. Regardless, however you arrive at these these ranges, it is crucial that executives buy into them because they will drive response levels and decision authority. Speaking of which…
Who decides?
What if, after a risk analysis has been performed, an audit finding or other concern falls into the High Risk category but organization management can’t or doesn’t want to treat it in alignment with the predefined response expectations? Who gets to sign-off on that decision?
When I was the CISO for one organization, we defined a table similar to the one below:
|
Risk Level |
Decision Authority |
|
Very High |
CEO or his/her cabinet |
|
High |
Line of business executive |
|
Medium |
Business process executive |
|
Low |
Department head |
|
Very Low |
Manager |
In other words — only the CEO or someone in his/her cabinet could choose to treat a Very High risk issue in a less aggressive manner than called for by the table (i.e., “accept it”). Another approach is to align risk acceptance authority levels with budget sign-off authority — e.g., if executives have budget authority of $500k then they can sign-off on High risk (given the ranges defined above).
This kind of table goes a long way toward clarifying who gets to accept what level of risk, which almost invariably improves decision-making. For example, a business process executive might be inclined to accept a significant amount of risk because they have their eye on the gold at the end of the rainbow. However, knowing they’d have to sell it to their boss, or their boss’s boss, tends to add a little perspective to their decision. In my experience, most of the time they back off of the throttle.
By the way, how an organization distributes risk acceptance authority is a subtle indication of its risk appetite. For example, an organization that lets mid-level management sign-off on Very High risk arguably has a greater risk appetite than one that requires c-level authority.
A complicating factor…
The quants in the audience might be squirming in their seats about now. “It’s not that simple!”, they might be thinking — and they’d be right. Quantitative risk measurement (done right) will never express risk as a single number because there’s always uncertainty in risk measurement. Consequently, risk measurement results should be expressed as a distribution of outcomes. For example, the chart below shows an annualized loss exposure of between (roughly) $5k and $400k, with a mode (most likely) of about $70k. So which number within this distribution do we use to compare against our table? The mode falls into one range in our table, the 90th percentile in another, and the max in yet another.
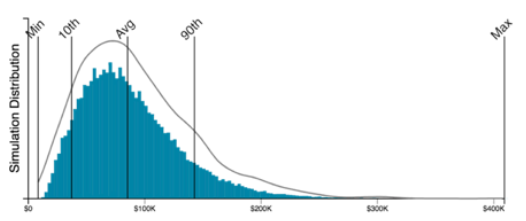
This is another important way in which organizations express their degree of risk aversion, because the farther out in the tail they standardize on for assigning the risk level, the more risk averse they are and the more aggressively they’ll treat an issue. For example, using the chart above, an organization that has standardized on the mode for comparison against the risk table is going to treat this as “Medium Risk”, whereas an organization that uses the 90th percentile will treat it as “High Risk”.
NOTE: If this complication really bothers you, and you think to yourself, “That’s a great example of why I’m sticking with qualitative or ordinal values for risk measurement!”, then I have bad news for you. The same problem (uncertainty) exists regardless of how you measure risk (Is that risk rating of “3” a best case, worst case, or most likely case…?). Using qualitative and ordinal risk measurements simply sweeps the problem of uncertainty under the rug. At least with quantitative analyses we’re able to faithfully express uncertainty so that decision-makers know what they’re dealing with.
What about residual risk?
All this is well and good when we’re wrestling specific concerns to the ground, but what about residual risk? For example, we might analyze an internet-facing application and find that even when it is compliant with all of the required controls, the 90th percentile (or whatever point in the distribution the organization standardizes on) is still in the High range because the application provides access to a lot of sensitive data, it faces a high threat landscape, and there’s only so much control that can be applied. In that case, the appropriate executive gets to decide that “it is what it is” and accept the residual risk.
Wrapping it up
Hopefully this post has provided some food for thought and practical options for incorporating risk appetite into tactical risk decision-making. In a future post (less than a year from now — I promise) we’ll tackle the strategic angle. Stay tuned…
See also
'Risk Appetite' vs. 'Risk Tolerance': What's the Difference?

-squared-1.png)
.png)


