 A couple of weeks ago I wrote a blog post pointing out some problems with NIST 800-30 (Fixing NIST 800-30). In response to my post, Richard Goyette offered an articulate defense of the NIST 800-30 approach in the comments section of that blog post. Today's blog post offers my take on Richard’s explanation.
Inaccurate assumptions
Richard’s entire argument rests on two assumptions: 1) that you have to base quantitative estimates of probability on statistically significant volumes of historical data, and 2) that someone doing quantitative probability estimates wouldn’t include forward-looking factors like potential changes in the threat landscape. As someone who has been doing quantitative risk analysis of infosec scenarios for over ten years, I can tell you that neither of those assumptions is accurate.
But let’s set aside those assumptions for the moment. In a risk analysis scenario Richard described, he said two things that bear examining:
- “Any risk assessment methodology based on likelihood “in the strict sense” alone will get this wrong.”
- That the practitioner would apply their “gut feel” to provide a qualitative likelihood estimate. In forming that estimate, they’d likely consider things like:
- Whether Tempest shielding is in place
- The capabilities of the threat community
- The nature of the signal (strength, information value, whether it’s encrypted, etc.)
- etc.
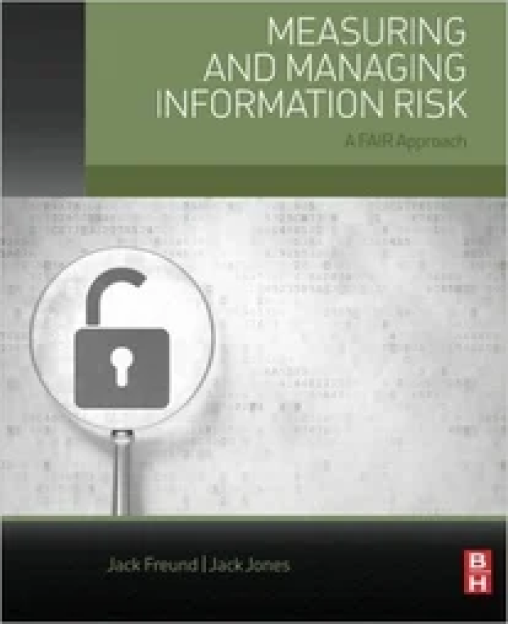
With all due respect to Richard, the first statement appears to reflect a limited understanding of well-established methods like calibrated estimates, PERT distributions, and Monte Carlo functions. With this in mind, I’d encourage people to read Douglas Hubbard’s book, How to Measure Anything. Another useful resource would be any good text on Bayesian analysis. Regarding his second statement, those are exactly the same considerations a subject matter expert (SME) would include in forming a calibrated quantitative probability estimate. I can’t count the number of times I’ve facilitated SME’s in making exactly these sorts of estimates, often on scenarios just as difficult as the one Richard described. And when dealing with high levels of uncertainty, you reflect that uncertainty by using wider, flatter distributions, which I'll touch on again in a bit.
No dependency required?
Regarding Richard’s statement that my approach assumes (actually, requires) a dependency between the horizontal and vertical axis of the G5 matrix — why yes, it does. His doesn’t? Then what’s the purpose of the matrix? In any matrix of this sort, if you look up a value in one axis, and then the other, and converge those values in the matrix to arrive at another value, you are invariably assuming that a relationship exists. The only way his approach makes sense is if the likelihood scales are different and/or nonlinear — e.g., Moderate Likelihood means something different depending on whether you’re talking about attack likelihood or overall likelihood. If that’s the case, then where/how is that difference defined? How would I explain that to an inquisitive executive? In order to expose this problem, let’s walk through a simple scenario:
- Let’s say that my website is faced with the potential for a denial of service (DoS) attack. It has never experienced a DoS attack in the past, but I still need to figure out how much I care about this risk because the potential does exist and I need to prioritize this against the other risks my organization faces.
- Given Richard’s approach, I’d speak with my threat intelligence SME’s, do some industry research, and choose some qualitative likelihood of attack value from table G2 based on my “gut feel”. For the sake of illustration, let’s say we chose “Moderate” as the likelihood of attack because the SME’s believe there is some indication that DoS activity will increase against my industry, but they don’t expect it to become rampant.
- Let’s also say that my network and server aren’t optimized to resist a DoS attack, and so my infrastructure SME’s say it is nearly 100% certain that the website will experience an outage if an attack takes place.
Using Richard’s logic (and 800-30’s Table G5) the overall likelihood of a DoS outage is High even though the likelihood of a DoS attack occurring in the first place is only Moderate. If I were an executive and someone from information security was asking for funds to improve our resistance to DoS attacks, here’s how the conversation might go (I’m leaving out the impact component to keep things simple):
- Infosec: We believe the likelihood of an outage from a DoS attack is High unless we spend $$$ on improvements.
- Me: How many DoS outages have we had in the past?
- Infosec: None to-date, but these types of attacks are increasing.
- Me: Do we expect an attack to occur this year?
- Infosec: There’s no way to know for sure.
- Me: I realize that, but I’m trying to get a feel for where this stands relative to other risk management efforts I need to fund. So what’s your best estimate?
- Infosec: Let me get back to you on that.
Actually, if it was me sitting across the table from the infosec practitioner, I guarantee the conversation would go deeper than that. You can also count on the fact that I’d go apoplectic if someone tried to pass off an analysis where Overall Likelihood was greater than Attack Likelihood.
Through a quantitative lens
But in fairness to Richard, let’s look at that same scenario through a quantitative lens.
- I’d speak with my threat intelligence SME’s and gather industry data, just as before. Only now I’d work with the SME’s to make a calibrated quantitative estimate. We would start with an absurd starting range (minimum and maximum) estimate that everyone in the room would bet a thousand dollars on. Maybe something like; “At least one DoS attack every million years, and no more than a million distinct DoS attacks per year.” We’d then consider the same forward-looking factors and data that we used to “guide our guts” under Richard’s approach, and begin narrowing that range until we had 90% confidence in the range (see Hubbard’s book for an explanation). In a truly complex and dynamic scenario, the range/distribution would likely be pretty wide and flat, which is perfectly fine. In fact, these wide/flat values can be highly informative. I've had plenty of conversations with executives about risk analyses where we had very little data for one data point or another. This surfaces opportunities to discuss improvements in visibility, and thus data, over time. Executives then have an opportunity to decide whether the resulting improvement in analysis precision is worth the cost.
- Using the same process, I’d then work with my infrastructure and threat intelligence SME’s to estimate the likelihood that a DoS attack, when/if one occurred, would result in an outage. No doubt we would consider historical improvements in attacker techniques and tools, as well as how they felt the threat landscape was evolving. Of course, the result of this estimate would reflect our uncertainty. The estimate also would reflect the fact that probability of attacker success can’t be greater than 100%.
- These two ranges/distributions would be combined using a Monte Carlo function to arrive at a range/distribution that reflects the overall likelihood of an outage due to a DoS attack. Given this approach, there is also 0% probability that Overall Likelihood would exceed Attack Likelihood.
In my lifetime?
Another concern I mentioned in my original post, that Richard didn’t discuss, is that 800-30’s qualitative ratings lack a timeframe reference, which means I don’t know if a High likelihood means something is highly likely to happen this week or in my lifetime. Without a timeframe context, I have no idea what High/Moderate/etc. means, which means I can’t rely on or reasonably prioritize the results of these risk analyses. Interestingly, my experience has been that as soon as you put a timeframe constraint on a qualitative likelihood estimate, the person making the estimate is automatically (very often subconsciously) basing their estimate on numbers. A short series of questions like, “You say it’s Moderately likely to happen this year. Do you think that’s greater or less than 50%?” will almost always reveal this. It doesn’t take long to help them define a range they’d actually bet money on, at least if they're reasonably strong at critical thinking. And if they don't have decent critical thinking skills, then they shouldn't be analyzing risk.
Summing it up
The bottom line is that the likelihood of future events doesn’t care whether you’re using qualitative or quantitative values — or whether you’re basing the measurement on copious amounts of empirical data or gut feel — the probability of an adverse outcome cannot exceed the probability of the event that generates that outcome.
At the end of the day, risk analysis is supposed to help stakeholders make well-informed decisions. Currently, it seems to me that NIST 800-30 doesn't fully support this objective, and the defense/explanation that Richard offered doesn’t give me any reason to change that perspective. Readers, of course, are free to choose which perspective aligns best with their understanding of effective risk analysis and measurement.


