What: Complementary Standards for Integrating Risk and Return
“Why do we receive performance data on Tuesday and risk management data on Wednesday, shouldn't risk and reward be reported together?”
– Question from a board member of a large financial firm, as reported by Alex Sidorenko, founder of RISK AWARENESS WEEK and CRO at a major European mining company
Series Overview
The FAIR™ Ontology and open SIPmath™ standard are complementary methodologies for managing risk and communicating uncertainty respectively. Combining FAIR and SIPmath provides a revolutionary way to link risk models with revenue models of various sorts to gain an enterprise-wide view of risk/return tradeoffs.
In this series, we will show how the FAIR-SIPmath approach enables:
- Integrated Risk/Opportunity Management: Connects risk, investment, and insurance, simplifying decisions and illuminating improving risk/return tradeoffs across the organization.
- Modularizing Risk and Opportunity: Like Lego blocks, risks and opportunities are divided into manageable pieces for a flexible, comprehensive approach to management at the enterprise level.
- Interactive Chance-Informed Dashboards: Instant feedback on management decisions is provided through intuitive, interactive dashboards, that foster chance-informed discussions among managers with differing risk appetites.
Read the blog post series on FAIR meets SIPmath
About the Authors
John Button
Gartner Risk Advisor. Managing editor of several publications including FAIR-CAM Control Physiology, Cultural Calamity, The Tao of Risk Management, and The Drone Age.
Dr. Sam Savage
Author of The Flaw of Averages – Why we Underestimate Risk in the Face of Uncertainty and Chancification – Fixing the Flaw of Averages, Executive Director – ProbabilityManagement.org, Adjunct Faculty – Stanford University Dept. of Civil & Environmental Engineering.
Eng-wee Yeo
Principal, Technology Risk Modeling & Methodology at Kaiser Permanente. He is responsible for modeling, simulating and assessing non-financial technology risks to support decision making.
The FAIR Institute welcomes submissions to our blog from our members. Please contact us.
A $20 Million Solution
How would your organization like to have an extra $20 Million? Healthcare Innovation describes how Kaiser Permanente will save this much through their Risk Quantification Program. It allows them to reinvest a portion of the savings into strategic initiatives to further reduce technology-related risk to the organization.
In a world of digital medicine, cyber risks, and rapidly changing technologies, decisions around investments, insurance, and risk management are intimately intertwined. Kaiser knew that reducing risk by one million dollars by forgoing two million dollars in revenues was not a winning business proposition. They recognized that the FAIR™ ontology could be linked to opportunities as well as risks with the open SIPmath™ standard. By combining these two complementary standards, Kaiser was able to aggregate their risk management and their investment and insurance decisions into an enterprise-wide profit model. We will describe how your organization can adopt the FAIR-SIPmath approach over a three-part series.
FAIR and SIPmath – Complementary Standards
FAIR and the discipline of probability management, which led to the SIPmath Standard were developed around the same period to address separate aspects of risk management: FAIR is devoted to calculating and illuminating risk. SIPmath is devoted to networking business simulations together, regardless of whether they involve risk or revenue. Recently organizations have started to integrate these complementary methodologies into a FAIR-SIPmath approach to create comprehensive enterprise-wide networks of risk and reward calculations.
To simplify the understanding of how these two interact, let's use an analogy: imagine risk illumination through computer simulations as equivalent to lighting up a house using electricity.
FAIR
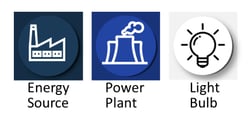 The FAIR Ontology provides a comprehensive framework to analyze risk. It simulates risk as a product of Loss Events and their corresponding Loss Magnitudes. In terms of our electricity analogy, the data science is the energy source, the simulation trials are the electric current and the risk illumination is the light bulb.
The Open SIPmath Data Standard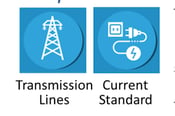 The Open SIPmath Data Standard for implementing the discipline of probability management, presents uncertainty as auditable data objects known as SIPs (Stochastic Information Packets). This standard enables risk simulations to be networked together. Think of SIPmath as distributing probabilities over transmission lines in a standard and usable form, much as the 60-cycle 120-volt AC power distribution standard and the familiar three-pronged plugs enable power networks to distribute electricity to our homes.
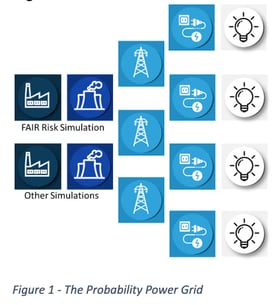
Other Simulations
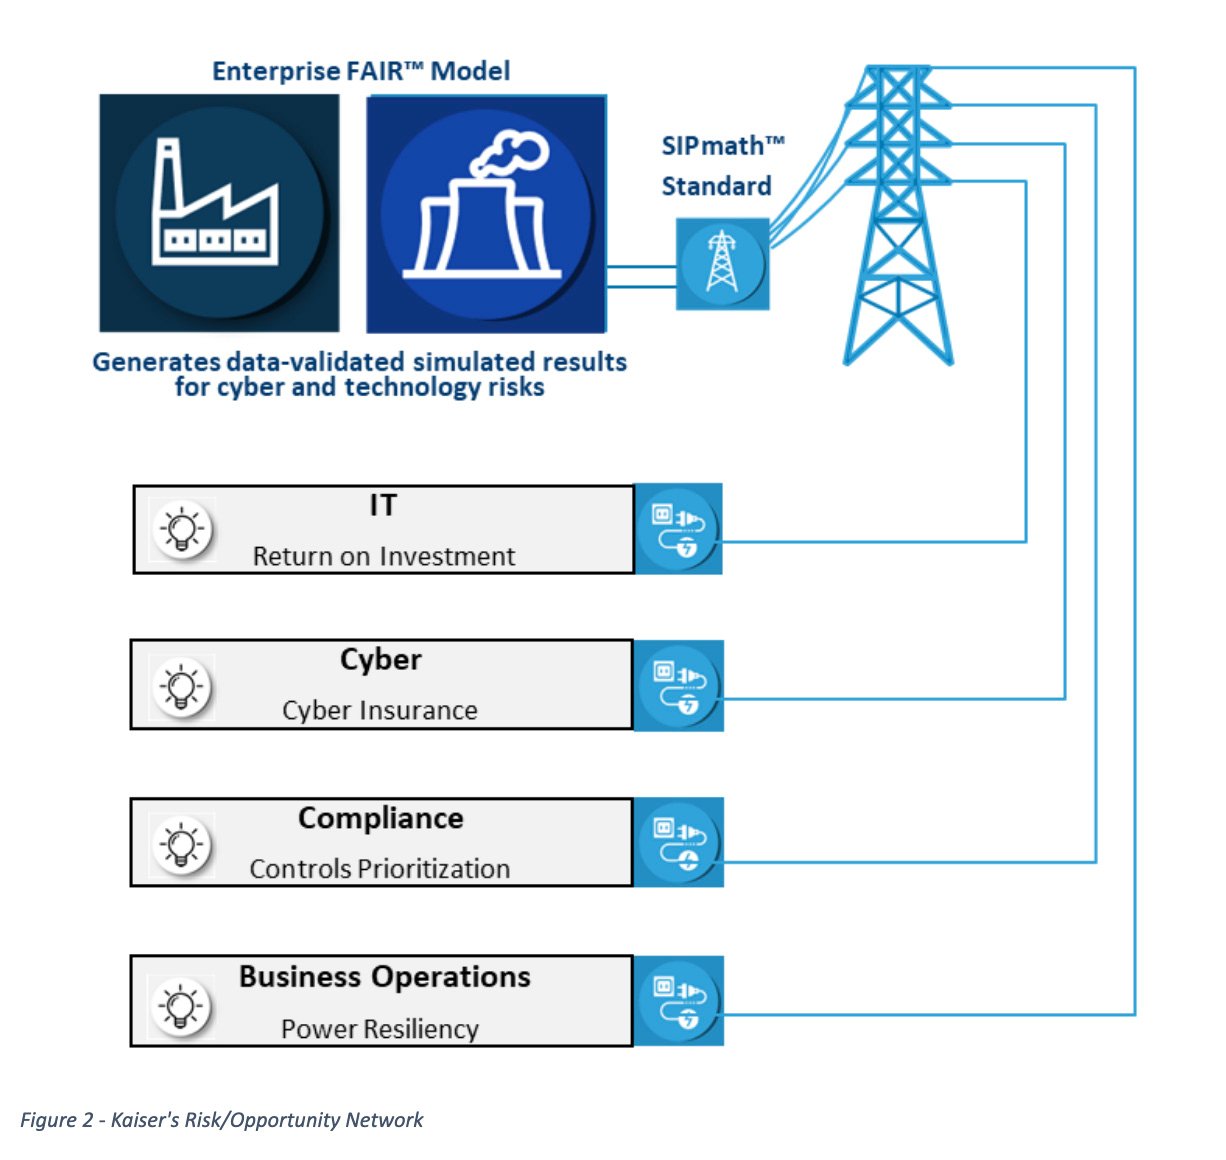
Any simulation, for example those involved with uncertain Revenues, Price Changes or Labor Disputes may easily read or write to the SIPmath Standard. Therefore, starting with FAIR and SIPmath it is possible in theory to build up a probability power grid that can analyze the risk/return tradeoffs facing the entire organization.
 The FAIR-SIPmath approach was used by Kaiser in this manner to create separate risk and opportunity modules. As shown in Figure 2 from Kaiser’s presentation at the 2022 Rocky Mountain Information Security Conference, the outputs of a FAIR implementation were used as inputs to other models including IT investment, Cyber Insurance, Compliance, and Business Operations.
Building Blocks: Object-Oriented Architecture
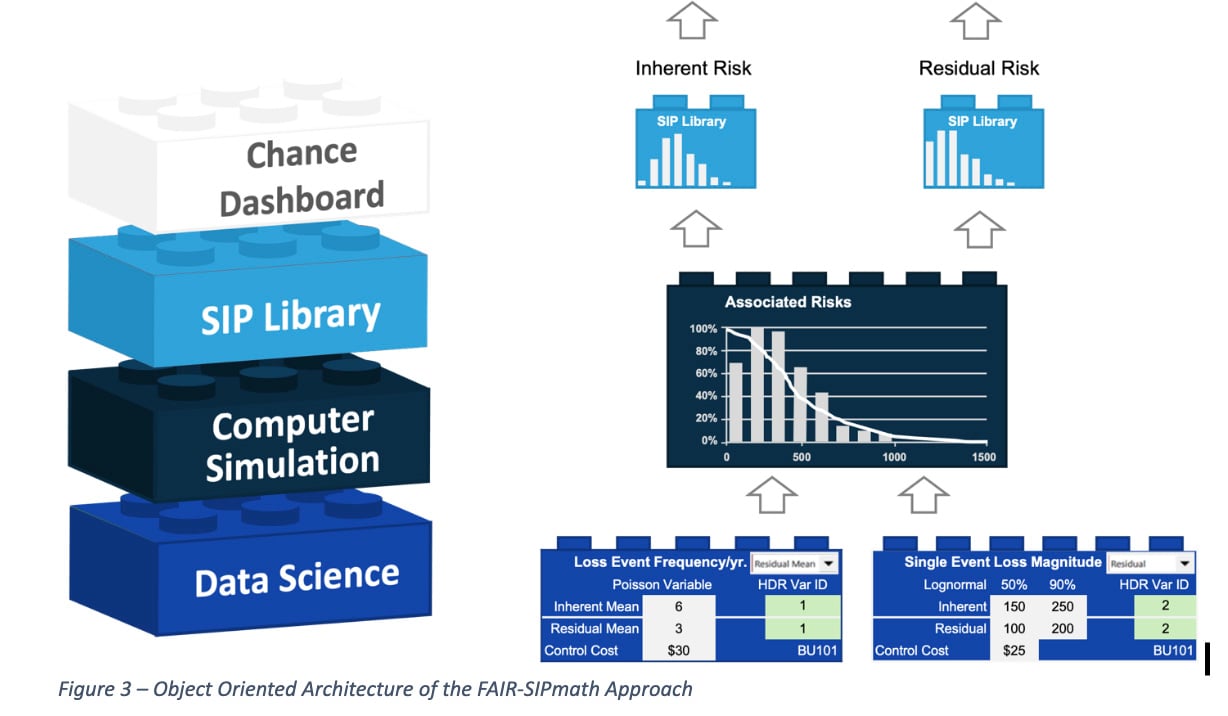
Traditionally the various blocks in the diagram above would have been built into a single monolithic computer simulation. This is analogous to entering all accounting data for a large organization into the same huge Excel spreadsheet instead of rolling numbers up from level to level.
SIP Libraries allow the output of one model to snap into the input of another model like building blocks, allowing risks to be rolled up like numbers. Starting from the bottom of Figure 3, there are essentially four levels of blocks.
- Data Analytics: determines the parameters of both risk and opportunity simulations.
- Computer Simulations: generate the SIP Libraries.
- SIP Libraries: Store and convey the results between models
- Chance-Informed Dashboards: provides interactive feedback to guide management decisions.
An Interactive Model is Worth 1,000 Pictures
Because effective risk management may require extensive computer time, results have often been presented to management as static reports. But now, by running many scenarios and simulation trials ahead of time and storing the results in SIP Libraries, top level decision makers can engage with interactive dashboards that may potentially reflect hours of computer time per keystroke. This creates greater engagement through a hands-on experience, termed “Limbic Analytics”, that intuitively links understanding (i.e. the seat-of-the-intellect) to action (i.e. the seat-of-the-pants).
Pick Your Platform
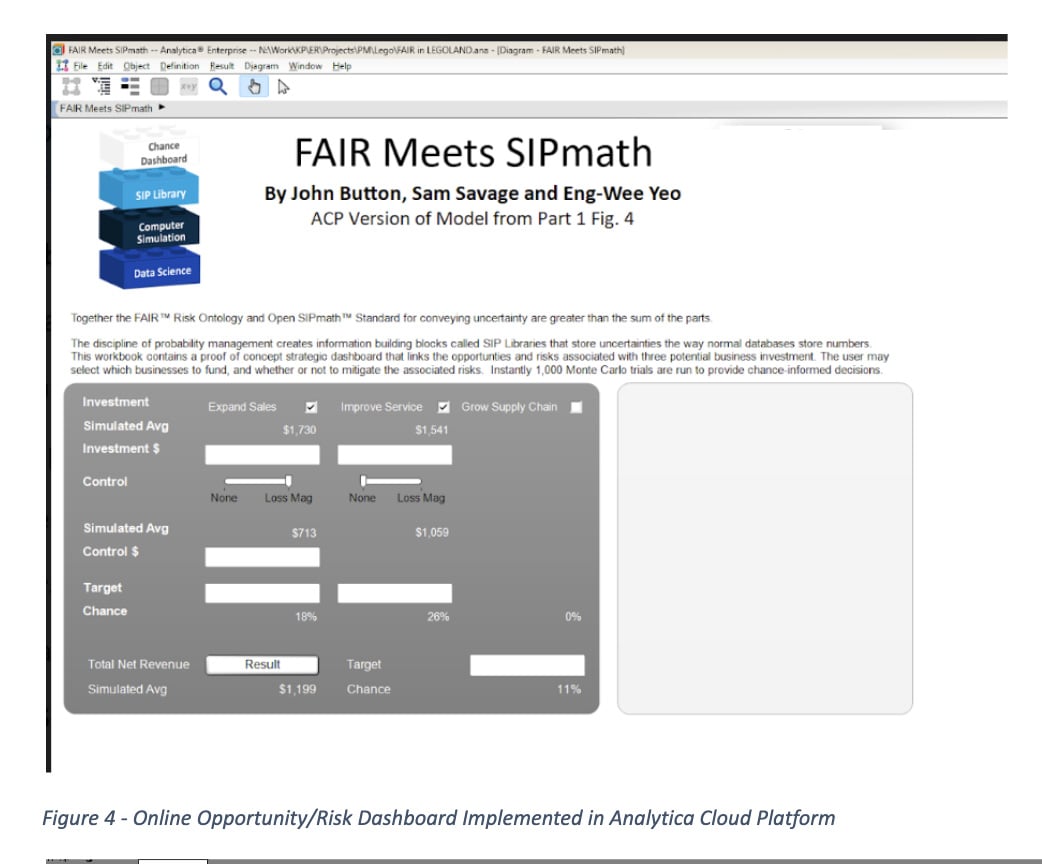
To demonstrate this, we have developed a set of companion proof-of-concept models to accompany this series. Although most of our examples are in Excel, the FAIR Ontology and SIPmath Standard are platform-independent, allowing building blocks to be developed across diverse computer environments or as web apps before being linked into a final network.
Figures 4 and 5, for example, display two interactive dashboards based on the same SIP Libraries. They each allow the decision makers to select one or more areas of business expansion, which has an inherent cyber risk, and then optionally invest to control that risk. The first model is an online dashboard created in Analytica Cloud Platform, while the second is a downloadable Excel file. Each model is based on the same SIP Library of 1,000 trials, and they give precisely the same risks and return results for the same input selections.

Click HERE to download.
In the next installment we will describe how such models are produced. We will also discuss who in your organization will be required to implement the FAIR-SIPmath approach. In the final installment we will explore how to use such a system to make management decisions that address the risk appetites of diverse stakeholders.