


How: Interactively Finding Your Organization’s Risk Appetite
“The biggest risk is not taking any risk... In a world that is changing really quickly, the only strategy that is guaranteed to fail is not taking risks.” - Mark Zuckerberg
Series Overview
The FAIR™ Ontology and open SIPmath™ standard are complementary methodologies for managing risk and communicating uncertainty respectively. Combining FAIR and SIPmath provides a revolutionary way to link risk models with revenue models of various sorts to gain an enterprise-wide view of risk/return tradeoffs.
Read the blog post series on FAIR meets SIPmath
Risk Is in the Eye of the Beholder
Is there a risk that XYZ stock will go down next week? It depends on who you ask. For someone with a lot invested in XYZ there is indeed a risk of it going down. For someone who has shorted XYZ, the risk is that it will go up. Risk is in the eye of the beholder.
Let’s explore a common way to assess people’s risk appetites. It is based on the bets you would make on the flip of a fair coin. We will compare four cases. In each case you get to choose between flipping the coin with a prize for HEADS and nothing for TAILS or forego the flip and opt to receive one tenth of the prize with certainty. Decide which you would do in each case.
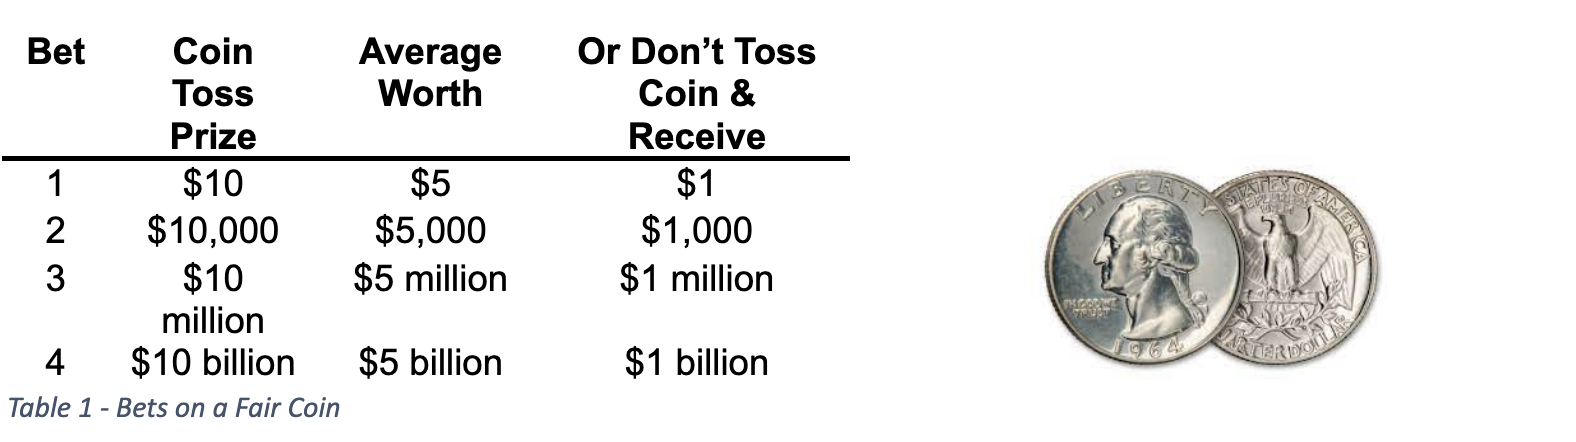
Almost everyone we know would flip the coin for bet 1, and no one we know would flip the coin for bet 4 (although we haven’t heard from Mark Zuckerberg yet). But everyone has a number X above which they would switch between flipping a coin for $10X and taking $X for certain. If your X is large, you have a big risk appetite. If your X is small, you have a small risk appetite.
The Efficient Frontier
The Efficient Frontier was the creation of Harry Markowitz, father of Modern Portfolio Theory and Nobel Laureate in Economics, who sadly passed away in June of 2023. In the early 1950s he was studying Investment as a graduate student at the University of Chicago. The prevailing knowledge of the time was that people should invest in the portfolio with the highest average return. Well, if you paint a paper towel tube red, tell people it is dynamite, hijack an airliner with it, ask for $1 Billion and have one chance in 1,000 of getting away with it you have an average return of a cool $1 Million. But average return does not reflect risk. Harry realized that a theory of investing would need to add a dimension for risk as well as average return, and thus was born his famous efficient frontier as shown in Figure 1.
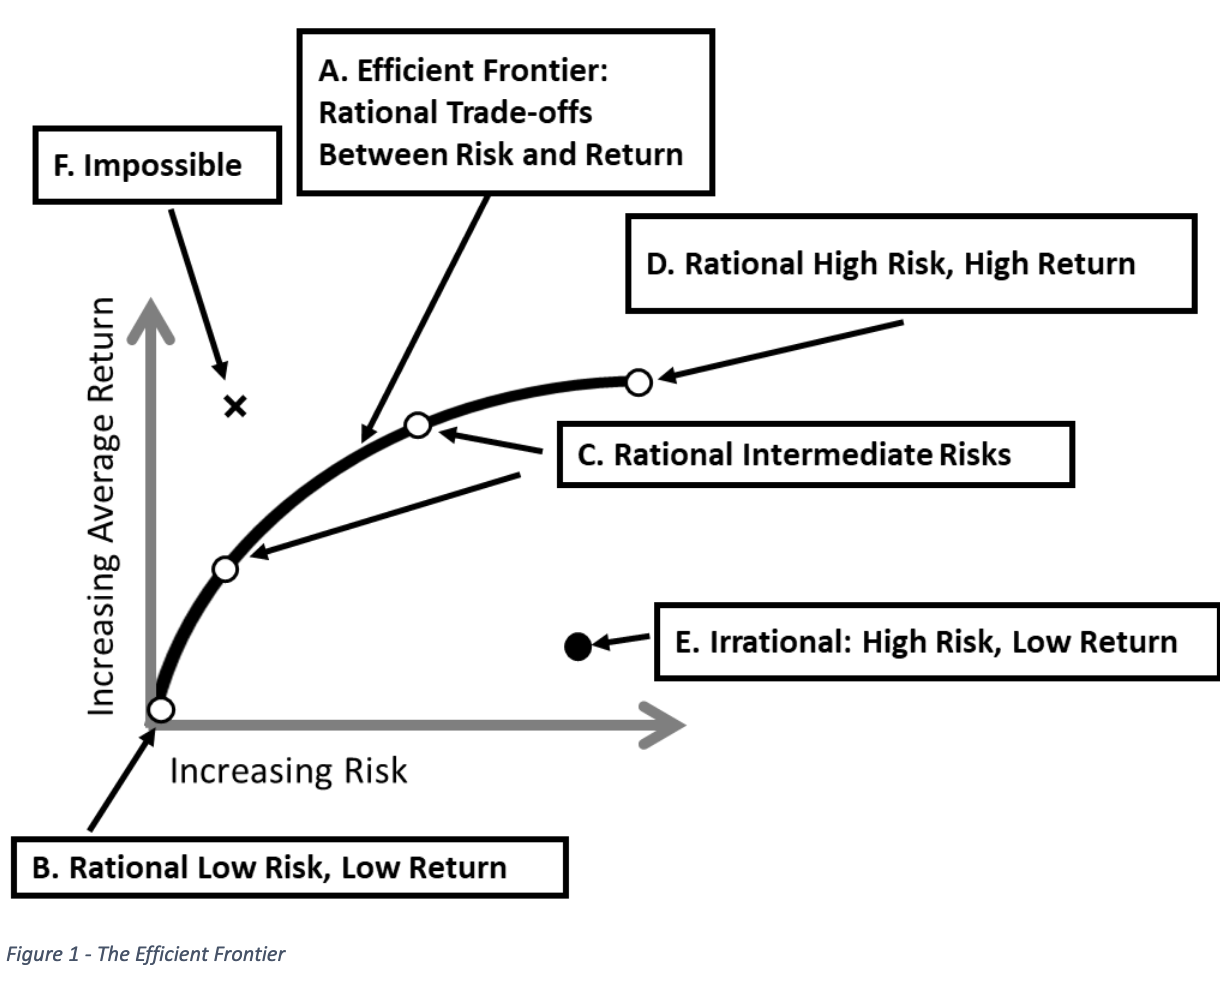
The horizontal axis shows the degree of risk, while the vertical axis shows average return. The black line (A) is the Efficient Frontier, which divides the Risk/Return plane up into three regions: Rational, Irrational, and Impossible. The Line itself represents rational tradeoffs between risk and return. The point you choose on this line depends on your appetite for risk. Those with no risk appetite would choose point (B) near the origin. Nothing ventured, nothing gained. Those with intermediate risk appetites would choose other points along the frontier (C), and those with the highest risk appetites would go as far up the frontier as possible (D). Any investment to the right of the frontier is irrational (E) because you could always find an investment that was both less risky and more rewarding by heading toward the frontier in the Northwestern direction. And anything to the left of the frontier (F) is impossible because the frontier is found by an algorithm that has already found the minimum risk for every level of return. In fact, the fraudster Bernie Madoff was caught by an astute securities executive who noticed that Madoff’s claimed performance put him in impossible territory.
The Interactive Dashboard
Although long used in financial portfolios, where the risks were better defined, the same approach can be applied to general portfolios of business opportunities. In the first large scale application of probability management, Royal Dutch Shell applied the approach to choosing their portfolio of petroleum exploration projects. By creating an interactive dashboard driven by pre-calculated SIP Libraries a group of decision makers with different perspectives was able to come to consensus. (1, 2)
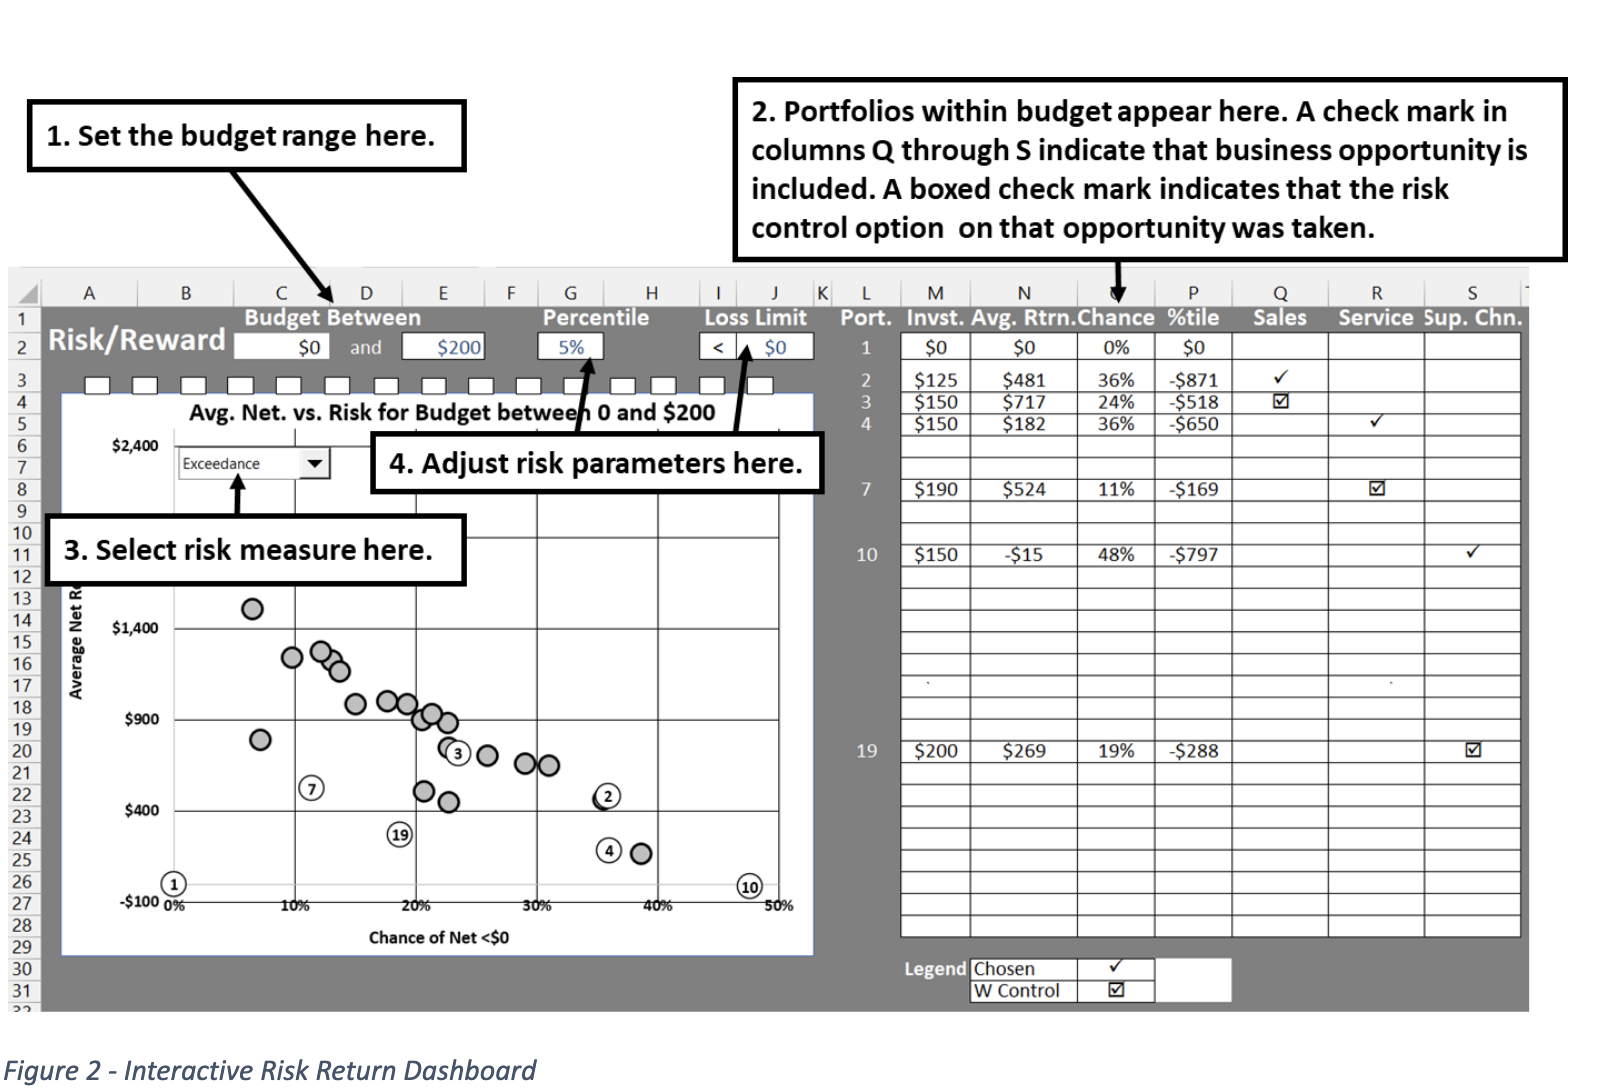
Figure 2 displays the details of an interactive Risk/Reward dashboard mentioned briefly in part 2. It is based on the SIP libraries generated from the Revenue and FAIR risk models described earlier and displays all 27 possible investment portfolios at once. Recall that each portfolio is assembled from multiple revenue and risk SIP Libraries. The dashboard is analogous to the Markowitz efficient frontier, except that it allows the user to specify various budget levels and different measures of risk.
The Vertical Revenue Axis
The Net Revenue of each portfolio of opportunities is calculated by adding up the Revenue SIP Libraries, subtracting the Risk SIP Libraries, investment costs and control costs following Figure 5 in Part 2. This results in a SIP of Revenues and possibly Losses for that portfolio, the Average of which is displayed on the Y Axis.
The Horizontal Risk Axis
In keeping with the tradition of Markowitz, the horizontal axis denotes risk. There are numerous ways to measure risk: Variance, Value at Risk, Percentiles, Exceedance Chances, etc. With earlier forms of analysis, the measure of risk needed to be chosen in advance and was baked into the analysis. With SIPmath, however the risk measure may be modified on the fly because the full distribution of results is always maintained in the SIP. Note that a high chance of exceedance is bad, so risk increases to the right. Now consider percentiles. The 5th percentile is a number that financial performance has only a 5% chance of being lower than, and might well be negative, representing a loss. This means that risk decreases to the right with percentiles.
We have chosen two measures of risk for this model: The Chance of Exceeding a specified limit, and a specified Percentile of total financial performance that includes both opportunities and risks. Note that as displayed, portfolios 1, 7 and 3 are the only ones on the efficient frontier.
The model may be downloaded from HERE, and is described in detail below.
- Set the budget limits. Portfolios with investment costs between the two limits will appear as white circles containing the portfolio number.
- All 27 portfolios are described on the right side of the chart. A ✔ mark under a business opportunity indicates that it is present in that portfolio. A 🗹 mark indicates that both the opportunity and its risk control are present in that portfolio.
- Select the risk measure, either Chance of Exceedance or Percentile, remembering that the direction of risk on the X axis changes.
- Specify the Exceedance Limit and Percentile for use in the risk calculations.
Such a dashboard can drive a chance-informed discussion among a team of managers with differing risk attitudes. Importantly the financial risks and returns shown here may help guide the conversation around less quantifiable business objectives. We suggest that you download the model. Let’s listen in to the discussion while adjusting the inputs.
CFO: We have a budget of $200,000. What is the least risky thing we can invest in?
Service Manager: Assuming we don’t keep the money in our mattress (portfolio 1) the safest bet is to improve service and put in a control for information risk (Portfolio 7). There is only about a 10% chance of losing money and on average we will net about $525,000.
Sales Manager: It’s really important that we increase sales and taking the sales project along with the risk control (Portfolio 3) nets us over $700,000 on average.
Service Manager: Right, but there is almost a 25% chance of losing money. Is it worth the extra risk?
The group does a quick vote, and although they all want to increase sales, they decide that the extra revenue of portfolio 3 over portfolio 7 is just not worth the extra risk. The Supply Chain Manager does not argue for growing the Supply Chain because it is clear to all that it adds a lot of risk and is not mission critical at this point. Before they close the meeting. The CFO adjusts the budget in the model.
CFO: Look at this. If we up the budget to $300,000 (increase cell E2 of the model to $300), we can increase sales with the risk control, and improve service without the control (Portfolio 6), for a net average revenue of $900,000 and just over a 20% chance of loss. I will take this up with the board. I think they will buy it!
Generating SIP Libraries from Agent Based Simulation
The previous examples of SIP Libraries have been based on very simple simulations. We will finish with one based on a very complex simulation.
There have been efforts to model cyber risk in the manner of safety risk, for example, at a nuclear reactor. This has a glaring defect: the nuclear reactor is not an intelligent adversary trying to circumvent your attempts to keep it from melting down.
Agent based simulations can have competing elements that duke it out in the game theoretic sense, continually attempting to thwart each other’s efforts. Jack Jones, Chairman of the FAIR Institute recently created such a simulation that ran for 10 hours, comparing the performance of 12 control strategies in each of 9 threat environments, for a total of 108 Experiments. By converting the output of the agent-based simulation to a SIP Library, we were able to quickly create interactive dashboards of various sorts.
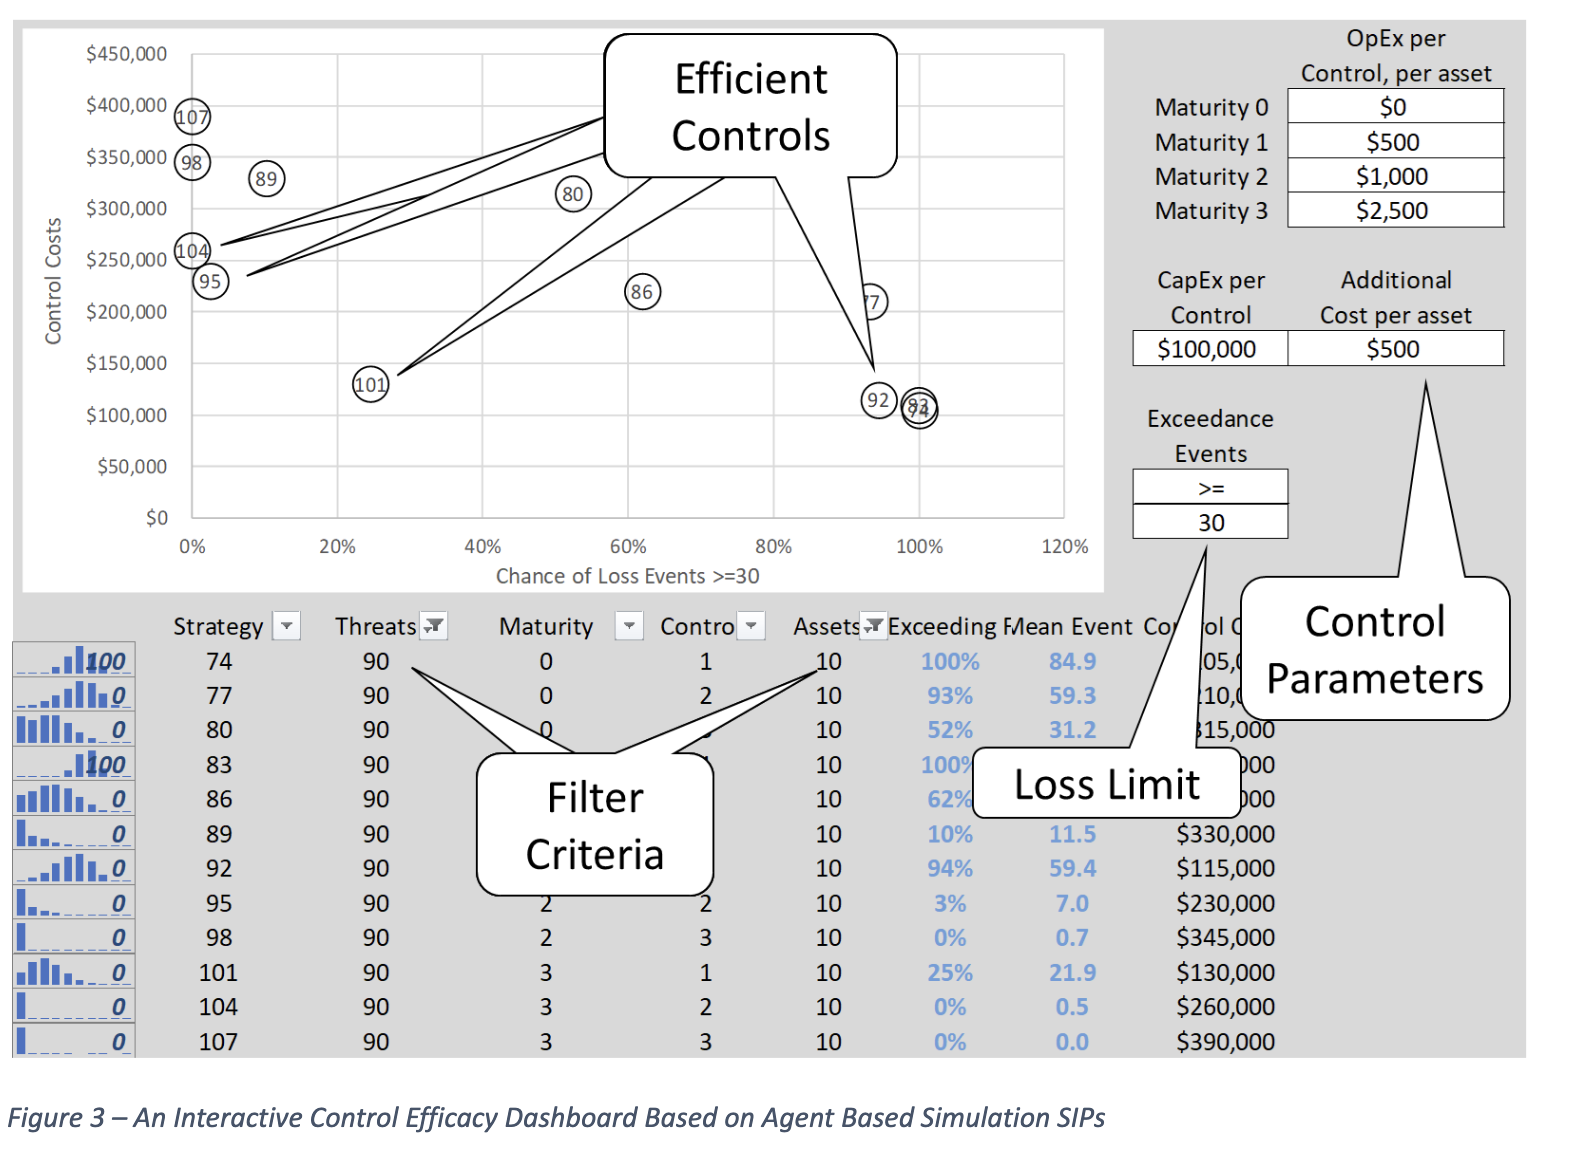
Figure 3 depicts a dashboard that filters on different threat environments defined by threat frequency and number of assets to protect. For each of the twelve control strategies it immediately plots both the cost and chance of exceeding a specified limit of loss events, implied by that strategy. Note that the efficient frontier is now in the Southwest. That is the lower the cost, the better. Strategies 104, 95,101 and 92 are efficient. Any strategy to the Northwest of these is inefficient and any to the Southwest are impossible. Note that strategy 74 and 83 both have a 100% chance of exceedance and are not considered sensible.
The user may filter in a new threat environment, specify loss limit, and control costs parameters and interactively assess the risk spend efficiency of the various control strategies.


.jpeg)
.png)
.png)