
Do you know how much you should spend on cybersecurity? It’s a simple question, yet the answer is terribly elusive. The goal of this article is to answer the following questions:
1. How much should we spend on cybersecurity?
2. What should we spend the cybersecurity dollars on?
This guide equips you with a toolkit to justify cybersecurity investments in a language your finance stakeholders will understand. By moving beyond the limitations of Return on Security Investment (ROSI) and leveraging tools like FAIR, Net Present Value (NPV), Internal Rate of Return (IRR), and the Gordon-Loeb model, we can make defensible, business-aligned decisions. Let’s dive into how we can reframe cyber risk as a calculated bet, using a simplified ransomware scenario to illustrate the process.
 Laura Voicu is Co-Chair, Swiss Chapter of the FAIR Institute, and Principal, Security Assurance, at Elastic in Zurich.
Reframing the Question: from ROSI to Optimal Spending
Let’s start with a bold statement: ROSI, while useful, falls short for long-term cybersecurity investments. As practitioners, we’re all familiar with ROSI’s simplicity—it’s a tactical cost-saving metric that’s great for quick wins. For small projects with paybacks within 12-24 months, ROSI shines because it’s easy to calculate and aligns with short-term budget cycles. Its benefits include:
- Familiarity: It’s already tracked, requiring no new math to explain.
- Speed: It’s a fast go/no-go screen for small projects.
- Low distortion: Discounting effects are minimal for short timeframes.
But ROSI has serious limitations when projected over three to five years. It ignores the time value of money, treating $1 saved today the same as $1 saved years from now. It collapses multi-year benefits into a single figure, failing to account for evolving attack surfaces, control decay, or changing Annualized Loss Expectancy (ALE). Most critically, ROSI misaligns with what boards care about: not the “biggest ROSI number,” but the optimal spend to reduce risk. Instead of discarding ROSI, I propose using it where it works: for short-term, tactical decisions, and complementing it with more robust tools for long-term strategic investments.
Instead of asking, “What’s the ROSI?” I challenge you to ask, “Is this the optimal amount to spend to reduce risk?” To answer this, I’ll introduce a ransomware scenario to demonstrate how FAIR, NPV, IRR, and Gordon-Loeb can guide strategic investments.
The Ransomware Scenario: a Focused Example
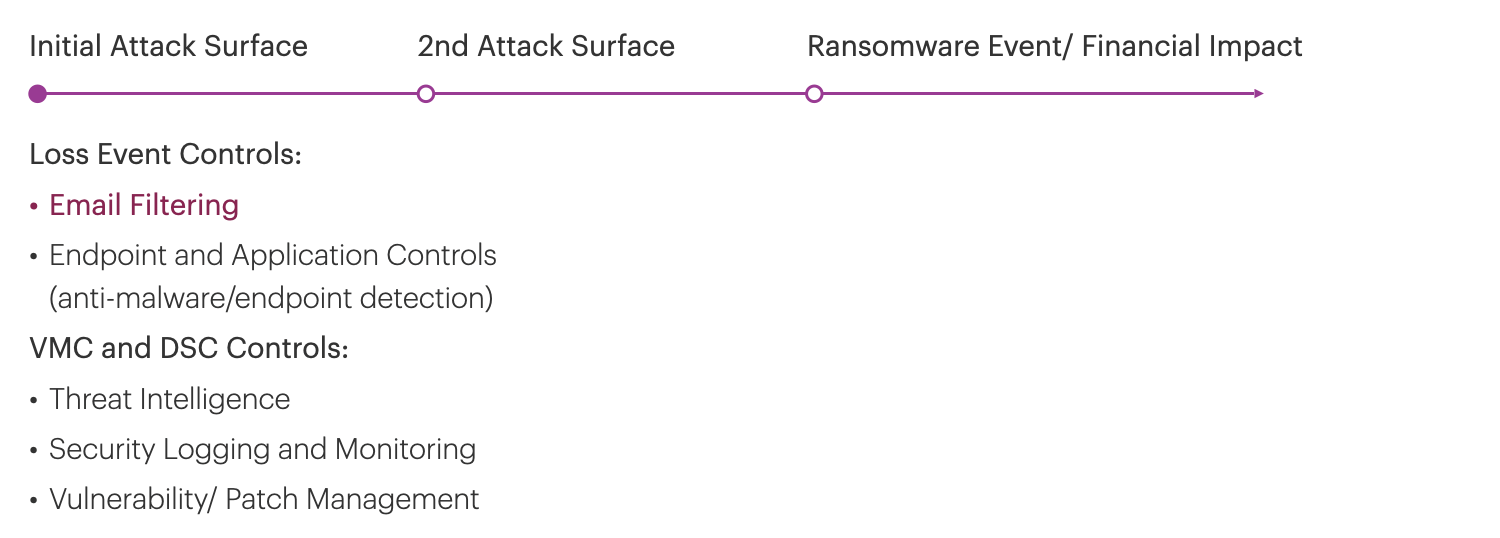
To make this practical, let’s use a simplified ransomware scenario targeting a large bank, deliberately focusing on spear-phishing emails as the initial attack surface to keep the example clear. While the full attack chain (e.g., lateral movement, encryption) needs to be accounted for in the analysis, let’s zero in on one control (email filtering) to illustrate how financial tools evaluate a single investment simply. Here’s the scenario:
- Threat: Financially motivated cybercriminal groups using Ransomware-as-a-Service (RaaS). These well-resourced gangs specialize in ransomware extortion, aiming to encrypt data and demand payment.
- Asset: The bank’s critical assets, including customer personal and financial data (e.g., account details, Social Security numbers) and transaction systems vital for business continuity.
- Method: The attacker gains initial access via a targeted spear-phishing email with a malicious attachment or link. While other vectors (e.g., software vulnerabilities) exist, phishing is the primary focus for this example.
- Effect: The attack causes
- Business Interruption: Downtime in online/mobile banking, leading to lost revenue and operational backlogs.
- Direct Financial Loss: Ransom payments (if paid), incident response costs (e.g., forensics, IT remediation), and staffing expenses.
- Regulatory and Legal Penalties: Fines for leaked PII, breach notification costs, and legal fees from lawsuits.
- Reputation Damage: Eroded customer trust, impacting long-term confidence and share value.
- Opportunity Costs: Missed business opportunities (e.g., new loans, trades) and increased insurance premiums.
This scenario sets the stage for evaluating a $1 million email filtering investment (including $700K initial costs and $100K/year maintenance), which reduces ALE by $4 million annually. Let’s walk through how we analyze this using our toolkit.
A Three-Step Process to Quantify Risk
Assuming familiarity with FAIR (Factor Analysis of Information Risk), let’s focus on the high-level process to apply it alongside financial metrics, without diving into the details of the FAIR model. The goal is to quantify risk in dollars and evaluate controls systematically. Here’s the workflow:

1. Identify:
- Define the decision: Should we invest in email filtering to mitigate ransomware risk?
- Specify the question: Spear-phishing as the initial attack vector.
- Outline the business context: Critical assets (bank’s data, transaction systems).

The outcome should be a well-defined risk scenario, as proposed by the FAIR taxonomy.

2. Analyze:
- Map the attack surface and loss chain, focusing on spear-phishing.
- Identify key controls (e.g., email filtering) and assess performance (see FAIR-CAM for metrics).

- Quantify Loss Event Frequency (LEF) and Loss Magnitude (LM) using FAIR’s loss forms (e.g., response costs, fines).
3. Evaluate:
- Calculate ALE, LEF, and LM using FAIR.
- Conduct what-if analysis to measure impact (e.g., email filtering reduces ALE by $4M/year).
- Prioritize cost of controls, and develop treatment plans.
In our scenario, a before-and-after simulation showed email filtering reducing ALE by $4 million annually. This figure accounts for the full attack chain but emphasizes the initial vector for clarity. FAIR practitioners will of course note that in practice the FAIR factors are distributions and not single point estimates. The reason for distributions rather than discrete numbers is the level of uncertainty for each of these factors, but we’ll focus on the most likely values for the sake of simplicity.

ROSI’s Pitfalls: A Closer Look
Despite attempts, I believe a true return is difficult with cybersecurity: the best we can do is a reduction in potential loss, or potential costs. For this reason some people are using the term return on security investment (ROSI) rather than ROI:
ROSI= (Benefits – Costs)/Costs
So, let’s invest $700,000 in an email filtering solution (Cost) that reduces our annualized expected loss by $4M/year (Benefit). The email filtering solution costs us $100,000/year to operate and our three year ROSI is $11M (assuming future benefits are not discounted, an assumption that will be revised in the next example).

If we are using ROSI as our justification measure then we’d most likely move forward with this investment.
Unfortunately, it’s not that simple. ROSI is a great tactical screen: it’s easy, familiar to finance, and works for quick wins where pay-back is under two years. But there are problems with using ROSI to justify cybersecurity investments. ROSI breaks down when we stretch the time horizon: it ignores the time value of money, assumes annual loss expectancy (ALE) stays flat and can’t cope with uncertainty. The other issue with ROSI is it’s not the same thing as optimizing corporate investment. In fact, from the CFO’s perspective, the goal of the firm is not maximizing ROSI, but rather deriving the optimal level of cybersecurity investment for the firm. These are two very different goals.
NPV and IRR: Speaking the Language of Finance
To address ROSI’s shortcomings, I’d like to introduce NPV and IRR, which account for time, uncertainty, and investment efficiency. Here’s how they apply to our scenario:
Net Present Value (NPV): NPV discounts future benefits to their present value, ensuring we compare apples to apples. Using a 15% discount rate—aligned with our finance team’s weighted average cost of capital (WACC), investment time horizon and scenario-specific risks—the email filtering project yields a positive NPV. This means the future risk reduction ($4M/year) outweighs today’s $1M spend. The diminishing returns over time are clear: year one’s benefit is worth more than year three’s.

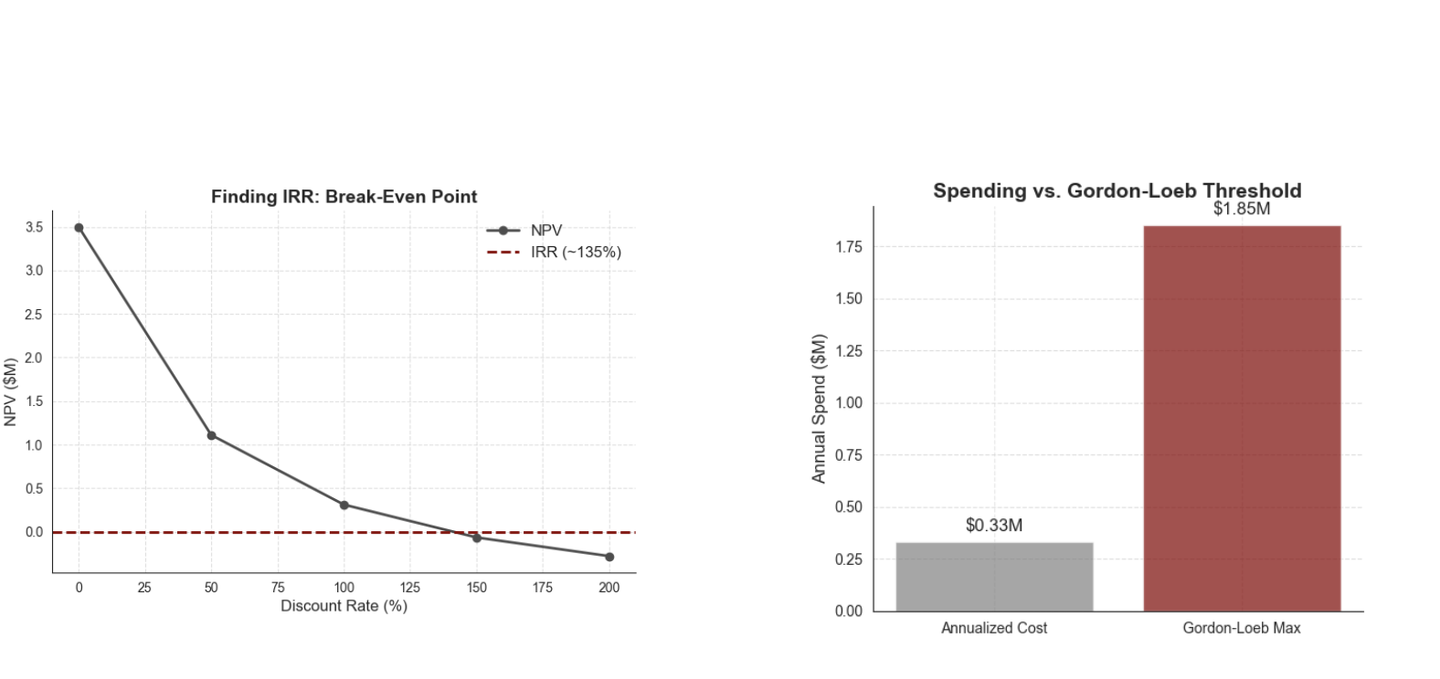
Internal Rate of Return (IRR): IRR is the “break-even” return rate that sets NPV to zero. In our case, the IRR is far exceeding our 15% hurdle rate, indicating a highly efficient investment.
Choosing the right discount rate is critical. I recommend collaborating early with your finance team to align on a rate (typically 10-30% for cybersecurity, depending on WACC and risk factors).
Be transparent about assumptions to build credibility with stakeholders because scenario-specific risk factors matter - Higher discount rates can be applied to scenarios with greater uncertainty in risk reduction estimates or greater uncertainty in projected benefits.
In our example, we’d make the investment because NPV >0 however, the NPV is substantially less than the ROSI. The reality of cybersecurity investments is there is significant risk involved, particularly when projecting expected loss reductions. What I really like about NPV is we can reflect this risk in the discount factor. For example, what if we double the discount rate to 30% or 35% to reflect the highly uncertain nature of our projections? This drops our NPV considerably compared to our initial ROSI projection and initial NPV. Most likely, we’d still make the investment since NPV >0, but it’s not the clear cut win we see with the ROSI, or even the initial NPV.
Gordon-Loeb: Keeping Spending in Check
How much is too much to spend on a control? The Gordon-Loeb model provides a guardrail: spend no more than ~37% of expected loss, as additional dollars yield diminishing returns. In our scenario, the $1M email filtering investment is well below this cap, ensuring efficiency. However, this is a guide, not a hard rule. For high-stakes scenarios you might justify spending more. Use Gordon-Loeb alongside NPV and IRR, but lean on your judgment to balance theory with business priorities.
To integrate these tools, I suggest a simple workflow: Use FAIR to quantify ALE reduction ($4M over three years), NPV to confirm financial viability (positive NPV at $1M cost), IRR to assess efficiency (way above the 15% hurdle), and Gordon-Loeb to cap spending. This answers, “Is this the optimal investment?” with a resounding “Yes, here’s why.”

Addressing Limitations
No model is perfect. FAIR, NPV rely on assumptions like risk reduction estimates, the quality of input data, and or evolving threat landscapes. Our $4M figure is a most likely estimate; validate it with empirical data and test sensitivity (e.g., ±20% ALE). The Gordon-Loeb’s 37% rule assumes specific conditions, so adjust for context. “All models are wrong, but some are useful”. Cybersecurity is a calculated bet, not a quest for zero risk. Partner early with your finance, IT, and procurement teams to refine assumptions and build a compelling case. A quick executive summary with NPV/IRR, and IRR charts can translate this for boards.
Final Thoughts
As practitioners, we’re tasked with protecting our organization while justifying every dollar. ROSI is a good start for quick wins, but for strategic bets - like multi-year ransomware defenses - we need FAIR and rigorous financial metrics and models. Our simplified ransomware scenario showed how to focus on one control to quantify risk, assess financial value, and avoid overspending. By speaking the language of the business, you’ll turn cyber risk into smarter investments.
I hope this framework empowers you to make better decisions. Try running a similar scenario through these tools, starting with a single control. Engage your finance team to align on the discount rates and watch your proposals gain traction. What’s your next cybersecurity bet?
Stay tuned for our continued in-depth and accurate modeling and forecasting of the value of security investments.