


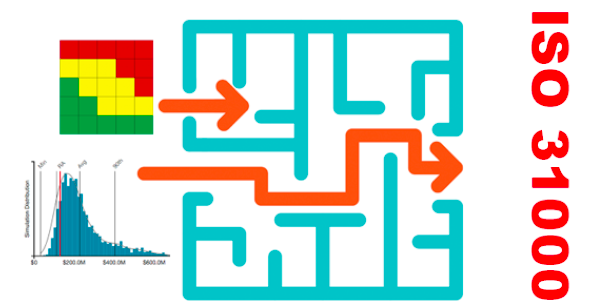
 I was recently re-reading ISO 31000 because that's what one does for fun (don't you?). Surprisingly I noticed on a few occasions that using heat maps (or qualitative RM) appears to not align with the guidelines.
This appeared odd since qualitative risk management using heat maps is, unfortunately, the most prevalent tool used for risk analysis. That’s what the majority of risk managers do in their quest to implement ISO 31000. The ISO 31000 guidelines generally maintain neutrality and don’t express an opinion in the qualitative vs. quantitative RM debate. It appears that the fine people behind the guidelines aren’t aware of their own biases and preferences ... or maybe I’m exaggerating and not aware of mine?
Osama Salah leads the UAE Chapter of the FAIR Institute in Abu Dhabi. Read an interview with Osama. This article originally appeared on LinkedIn.
Let's start with the "Principles" clause.
The principle "b) Structured and comprehensive" states that the risk management approach should contribute to "consistent and comparable results."
How consistent or comparable do we expect heat map results, which I understand as all the information that available to make a decision, to be?
Douglas W. Hubbard and Richard Seiersen in their must-read book "How to Measure Anything in Cybersecurity Risk" write about how experts left to their own devices change their judgement if presented with the same information at different times (this is called stability) and how experts disagree with others experts (consensus). So typically there are situations where experts change their estimates or don’t agree. That’s a general observation. There are methods to deal with this phenomenon like calibration training or averaging results from multiple experts (collected independently to avoid groupthink). Do heat map practitioners use any of these methods? Calibration training does not make any sense when using heat maps since we don’t make estimates to start with. Estimation of values like probability and consequence would require defining a minimum, maximum and most likely value. Instead, heat map practitioners pick a predefined range or labeled box (like “high” or “very likely” etc.). I also doubt they use any averaging. Averaging in labels is bogus math, besides the average of “3” and “4” for example would be “3.5” but there is no likelihood or consequence box labeled “3.5”.
Then we have the requirement to provide “comparable results”. Philip Thomas, Reidar B. Bratvold and J. Eric Bickel in their research paper “The Risk of Using Risk Matrices” say:
“This paper discusses and illustrates how RMs produce arbitrary decisions and risk-management actions.”
“Thus, we again see that the guidance provided by RMs is arbitrary, being determined by arbitrary design choices that have no scientific basis.”
If results are “arbitrary” isn’t that already a judgement that there is no basis for “comparable results”?
Louis Anthony (Tony) Cox, Jr. in “What’s Wrong with Risk Matrices” says: “Inputs to risk matrices (e.g., frequency and severity categorizations) and resulting outputs (i.e., risk ratings) require subjective interpretation, and different users may obtain opposite ratings of the same quantitative risks.”
One cannot defensibly argue that this level of inconsistency can produce “comparable results”.
Another principle is "f) Best available information". Here it states "Risk management explicitly takes into account any limitations and uncertainties associated with such information and expectations."
I would argue that heat maps do the exact opposite as they hide "limitations and uncertainties." Where in a heat map do you express your uncertainty in the estimation of likelihood or consequence? When you pick a likelihood or consequence, you don't express your uncertainty. The "ranges" of the buckets provided don't count as an uncertainty expression since they don't change with the scenarios. The descriptions of buckets/ranges like probability “0.1 to 0.3” or consequences ranges like “$100 to $10K” remain the same for each analyzed scenario. If we accept for argument’s sake that these ranges are expressions of uncertainty, then every estimate done in all scenarios has the same level of uncertainty. This would be nonsensical.
Not that we need to take the argument further but the results of a heat map (the ranking) also lacks an expression of uncertainty.
Calibrated estimates, probability distributions and probability simulations (Monte Carlo) specifically include and express uncertainty. Even the calibration of experts includes an expression of uncertainty. When we speak of an expert that is “90% calibrated” we mean that typically 9 out of 10 times the expert will make accurate estimates and 1 in 10 times they will get it wrong.
"g) Human and cultural factors"
It is commendable that ISO 31000 acknowledges behavioral economics, cognitive biases, etc. but does anyone believe that heat maps or other highly subjective qualitative risk management practices deal with this in any meaningful way? FAIR and calibration training typically address this. FAIR being a quantitative method inherently deals with many cognitive biases or at minimum is far less impacted by them than qualitative methods.
"h) Continual improvement"
Here is where we typically quote Peter Drucker or Lord Kelvin, but I will spare you this time.
How do you effectively improve something that you don't measure? Improvements in risk management are already hard. It can take a very long time to experience confirmation of our decisions. The feedback loops can be quite lengthy. For example, when we estimate that something can happen once every ten years, you won’t if you were right about your estimate until a decade passes and preferably a few more so you can make a reliable judgement (You could know earlier if you were wrong if the event happens more often than estimated.)
With heat maps, you have next to no record of what led to your likelihood and consequence estimates and thus no basis to track their validity. Quite often the estimate was done based on the most vocal member in the risk analysis workshop.
Instead of waiting 10 years to figure out if we were right or wrong we focus on making sure that the underlying assumptions, models, etc. of our decision making are scientifically sound (which isn't the case with heat maps). I’ve yet to see a defensible argument for decision making based on heat maps. It feels like heat maps work in reverse, i.e. they document a decision already made consciously or unconsciously.
With the FAIR model we can track our estimates. For example, we could track our estimates for threat event frequency, vulnerability, the probability of action, etc. and review if there is new insight justifying to update our estimates or evidence that validates them. They can work as leading indicators. That’s additional to the documentation of data sources, our confidence in them, scope, assumptions etc.
 "e) Dynamic"
Heat maps do not support the dynamism that is suggested in this principle. Responding to change in an environment with a high number of risks is very challenging with heat maps.
Imagine you find out that a control is performing far worse then you anticipated (or surprisingly it performs far better), how fast can you re-analyse the relevant scenarios using heat maps? Since heat maps usually aren't based on a model like FAIR this task would end up as a new analysis. Using a model like FAIR, one would review the resistance strength estimates, rerun the analysis (for all the relevant scenarios) and review the results. You would only need to validate the updated expert opinion. With heat maps, you would have to start a new risk analysis workshop including all the arguments, debates etc. since there is no reference model to use. There is also the risk that the risk will remain in the same box or transition into another box with the same color. The change might not result in any useful update to support decision making.
The above were principles that I believe heat maps are unable to satisfy (or qualitative risk management in general). Let us look at a few more statements from the document.
Look at "6.2 Communication and Consultation", it states:
"The purpose of communication and consultation is to assist relevant stakeholders in understanding risk, the basis on which decisions are made and the reasons why particular actions are required."
Heat maps give an illusion of communication. Heat maps set the scene for “risk management theatre.” Set aside for the time being that risk ranking can be utterly wrong with heat maps meaning that the qualitative ranking does not match the quantitative ranking. What communication value do two black dots in a red box have? What are they communicating when quantitatively one is 100 times larger? What does a dot in a red box tell about how much the organization should spend on the treatment? Should I focus on that risk in the red box or on those three risks in the orange boxes? The estimates for likelihood and consequence represent worst case, most likely, some average?
Philip Thomas, Reidar B. Bratvold and J. Eric Bickel in their research paper “The Risk of Using Risk Matrices” studied “The difference in how risk is portrayed in the RM vs. the expected values” using the Lie Factor coined by Edward Tufte and Graves-Morris. After their analysis they concluded:
“How can it be argued that a method that distorts the information underlying an engineering decision in nonuniform and uncontrolled ways is an industry best practice? The burden of proof is squarely on the shoulders of those who would recommend the use of such methods to prove that these obvious inconsistencies do not impair decision making, much less improve it, as is often claimed.”
How can anyone defend heat maps as an acceptable communication tool that can inform decision making?
The business speaks in dollars not colors, and that is exactly what a quantitative model like FAIR does. Heat maps neither communicate anything of meaning nor do they consult. Here is a blog post demonstrating what information you can get from a quantitative risk management report.
"6.3.4 Defining Risk Criteria", states:
"The organization should specify the amount and type of risk that it may or may not take, relative to objectives."
To me, "amount" implies some sort of quantification. How can anyone justify that the bogus math used in risk ranking qualifies as an "amount". Risk criteria end up being mapped to the colors of the heat maps and not actual loss exposures. How do you “specify the amount … of risk” relative to objectives? Are objectives measured in colors?
“6.5.2 Selection of risk treatment options” states:
“Selecting the most appropriate risk treatment option(s) involves balancing the potential benefits derived in relation to the achievement of the objectives against costs, effort or disadvantages of implementation.”
How can you achieve this defensibly using heat maps? How do you justify the investment in a treatment plan? How do you justify that one treatment plan is more beneficial than another? How do you know if you are spending too much or too little?
Heat maps don’t support cost-benefit analysis, but quantitative risk management methods like FAIR do by articulating cyber risk in financial terms.
Conclusion
ISO 31000 is an excellent and concise document. It acknowledges the challenges that we need to deal with to achieve informed decision making in the context of risk management. However, practitioners that choose heat maps will not achieve this objective as they don't seem aligned with the guidelines. FAIR acknowledges the same challenges and deals with them head-on.
Related:

-squared-1.png)
.png)


