NIST CSF has continued to grow in terms of its adoption as a framework for evaluating and characterizing the condition of cybersecurity programs. With it, organizations can relatively quickly and easily evaluate their cybersecurity program and communicate the results in an easily digested form for management.
 Jack Jones is Chairman of the FAIR Institute and creator of the FAIR standard for quantifying cyber and operational risk. Read Jack's introduction to FAIR-CAM (FAIR Institute membership required).
As a tool for risk measurement and prioritization, however, control frameworks of this sort have at least one key limitation — they only account for one piece of the analytic puzzle.
The best analogy I’ve been able to come up with is that control frameworks such as NIST CSF, CIS Controls, ISO, etc. are roughly equivalent to anatomy in the practice of medicine. Medical anatomy describes the parts of the body, their physical properties, and where they’re located. Similarly, control frameworks describe the things that could (or should) make up a cybersecurity program.
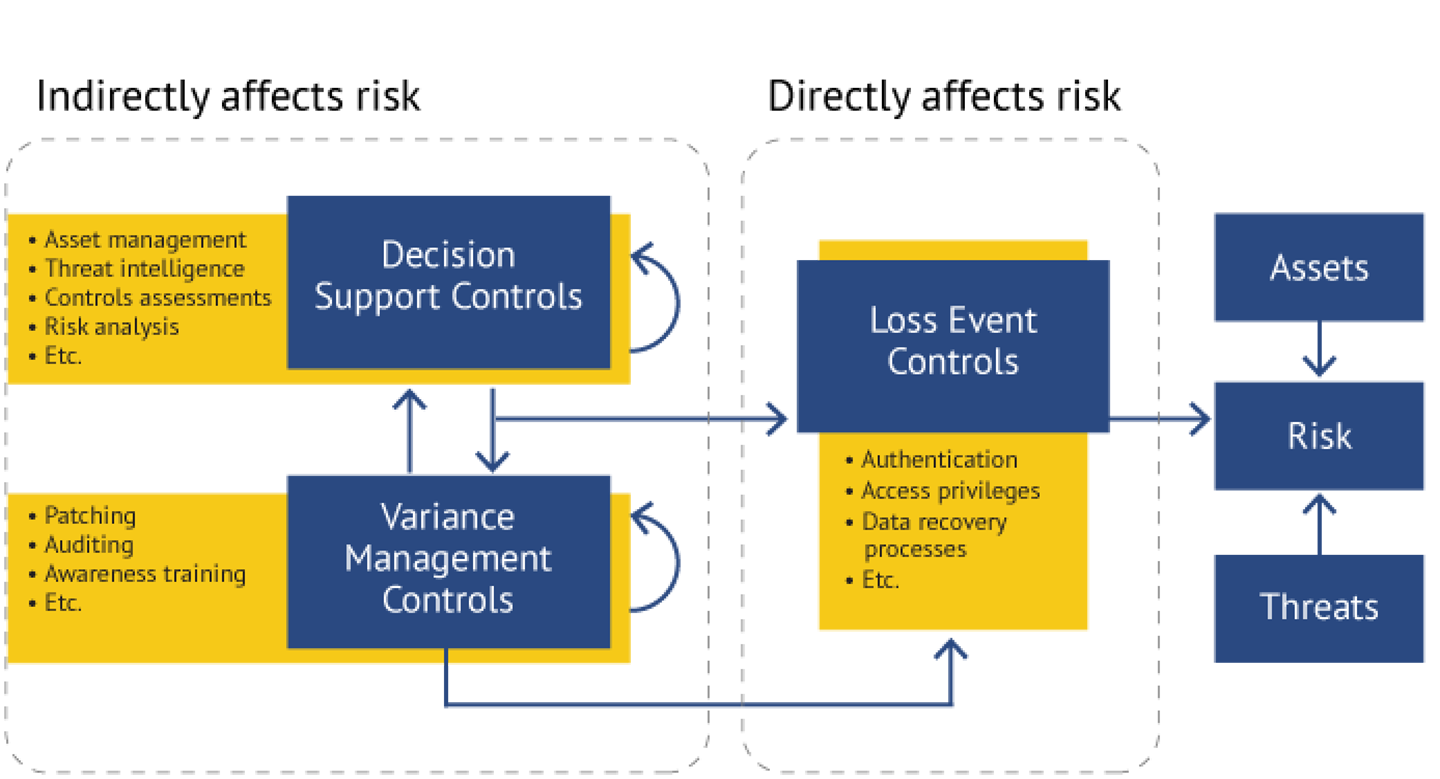
In medicine, however, the necessary companion to anatomy is physiology — i.e., how the parts of the body work, both independently and as a system with complex interdependencies. This physiology companion piece has been missing in cybersecurity and risk management, and that’s the gap that FAIR-CAM fills.
It describes the risk reduction functions that controls fulfill, both individually and as a system of interdependent parts. Given this physiological understanding of controls we will be able to apply control frameworks like NIST CSF much more effectively.
With that in mind, the FAIR Institute is excited to publish a draft mapping of NIST CSF 1.1 to FAIR-CAM. Organizations can use this mapping to more accurately understand how gaps or deficiencies in CSF subcategories may affect the amount of risk they have, as well as which improvements may have the greatest effect.
We anticipate, however, that initially this mapping will generate some questions, for example:
“Why was this subcategory mapped to this FAIR-CAM function rather than that function?”
“How do I apply this to determine which subcategory improvements will provide the greatest risk reduction?”
The Notes tab in the mapping spreadsheet provides an explanation of the method and challenges associated with the mapping process, which hopefully will give you a sense of why subcategories were mapped the way they were. It also touches on some of the challenges associated with the question regarding how to apply it in risk measurement. A white paper is being written to discuss these challenges and a proposed solution.
For the next 90 days, the FAIR Institute invites questions and suggestions from FAIR Institute members about this mapping, and has set up a specific LinkedIn post in the Member LinkedIn Group for this purpose. We look forward to engaging in the dialog there, and greatly appreciate the community’s support.