Three experienced FAIR™ (Factor Analysis of Information Risk) practitioners got together at the 2021 FAIR Conference (FAIRCON21) to compare notes on best practices for reporting to the board with risk quantification. Their bottom-line advice for a board command performance: Keep it simple and relatable to what the audience already knows.
FAIRCON21
Panel - Experiences from the Field: Reporting Top Risks to the Board
Moderator: Chris Patteson, Executive Director – Risk Transformation Office, Archer
Johann Balaguer, Director, Global Security, Ultimate Kronos Group (UKG)
Michael Moresco, Sr. Security Policy and Risk Manager, ServiceNow
FAIR Institute members can watch the video of this FAIRCON21 session in the LINK member community. Not a member yet? Join the FAIR Institute now, then sign up for LINK.
Visual aids help, too. Michael Moresco and Johann Balaguer shared two slides they’ve used to walk board members through a presentation based on FAIR cyber risk quantification.
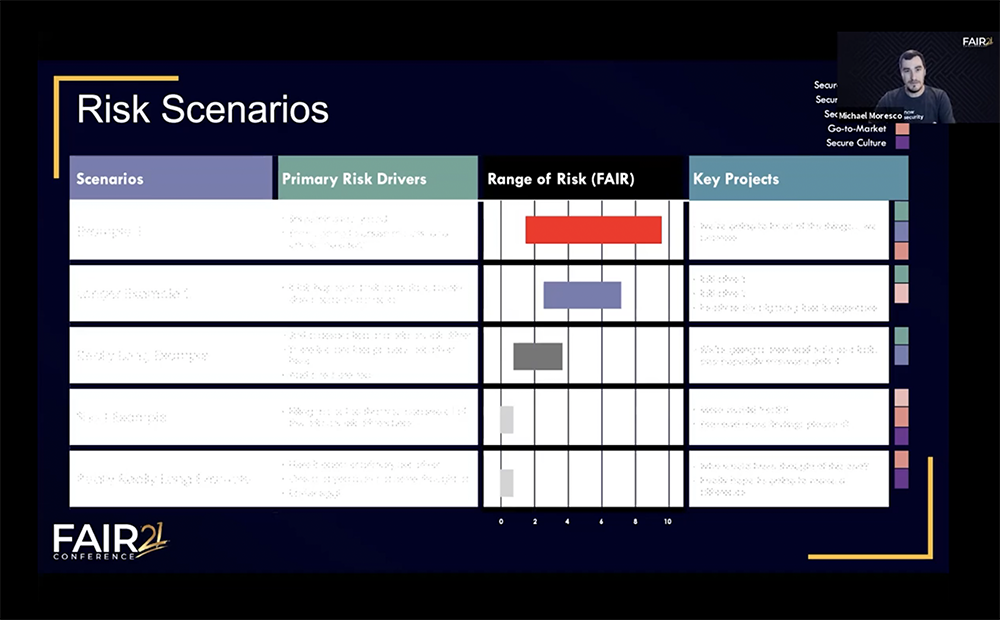
 This chart Michael recommends for organizations new to FAIR (or in cases when the legal department doesn’t want to see risk communicated in dollar terms alongside vulnerabilities).
On the left are high-level security risk scenarios – DDoS attack, data breach, etc. Next are primary risk drivers identified in quantitative analysis, the issues or gaps that lead to frequency or magnitude of attacks increasing.
Then a range of risk estimated with FAIR. “It’s a zero-to-ten scale so we’ve translated that quantitative assessment to qualitative,” Michael said, “but still harnessed the value of FAIR to say ‘here’s an accurate range of how much risk we actually have with these specific scenarios.’”
On the right are projects to mitigate the identified risks. “Typically, when going to a board-level presentation, you want to go in with solutions” and show how the projects tie into the CIO or CISO priorities and ultimately the corporate KPIs.
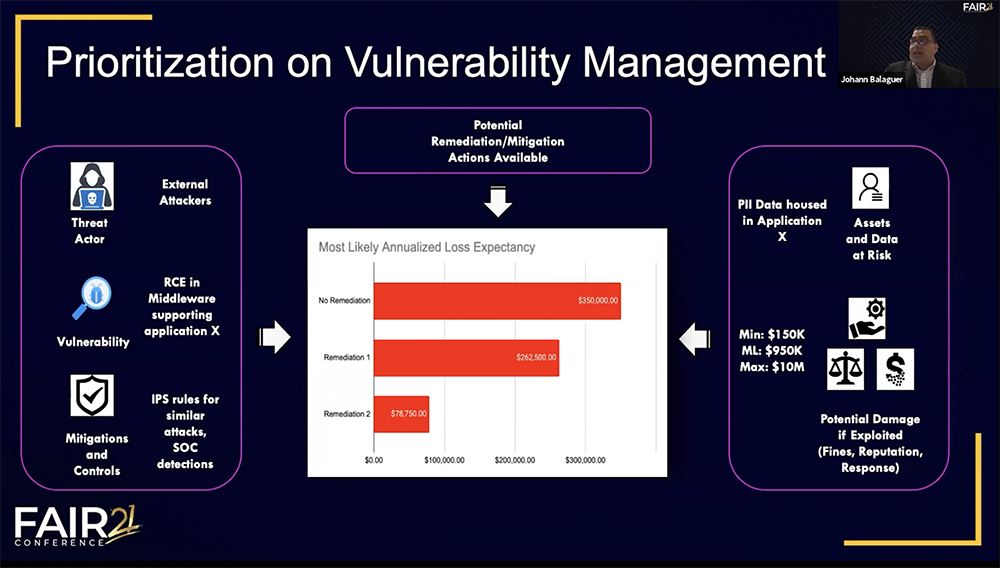
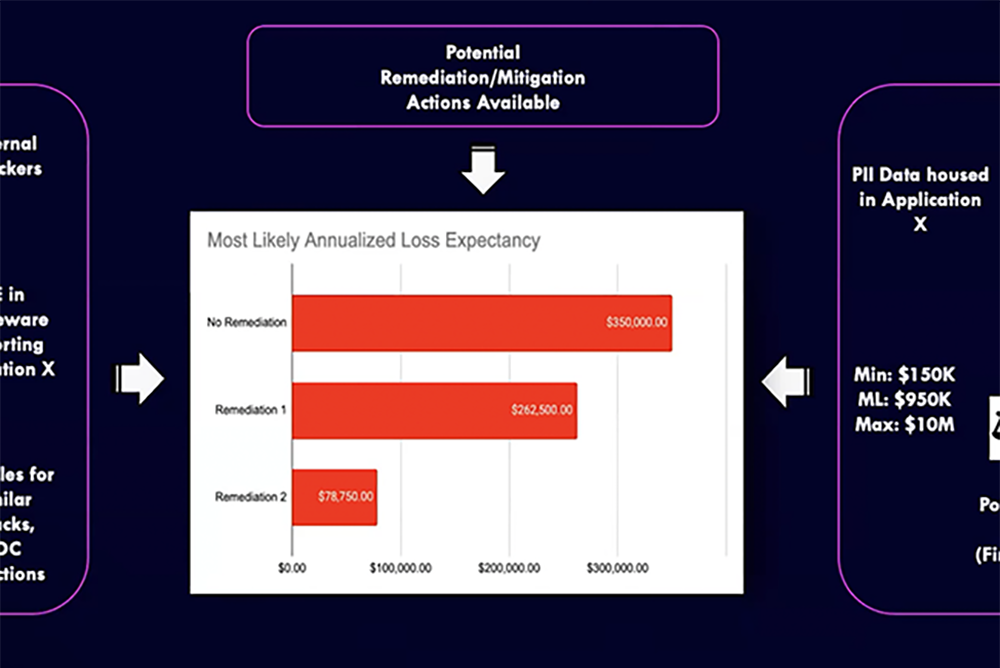
 Johann’s board-ready slide sets the output of FAIR quantitative analysis, annualized loss expectancy (ALE), in a relatable context, in this case demonstrating how the team uses FAIR to prioritize vulnerability management. A presenter can walk the audience through an explanation of the threat actors, vulnerability, controls, the asset at risk and finally the loss exposure and probable risk reduction of alternative treatments.
“Having an example like this helps them to visualize what’s at risk, what’s the probability of the impact, what are mitigations options you can leverage to remediate or manage that risk,” Johann said. “Then it’s going back and tying those key projects that we can apply to manage or remediate this issue across the board.”
Watch the complete video of the session on board reporting -- register now at no charge to view all the FAIRCON21 sessions on video.