


 Cyber risk analysis must scale to meet the rising challenges of cybersecurity, and automation of quantitative analysis will get us there. But we also have to understand and be able to defend the analytics that underpin any form of automation.
The new FAIR Controls Analytics Model (FAIR-CAM™) gives us a solid, defensible way to automate cyber risk analysis, based on FAIR™, the standard for cyber risk quantification.
Those were the messages in a session at the recent 2022 FAIR Conference (FAIRCON22) from Jack Jones, creator of FAIR and Bryan Smith, CTO of RiskLens, who is developing an analytical tool that puts FAIR-CAM to work.
Watch the FAIRCON session video:
How to Scale FAIR Programs with Controls Analytics
A FAIR Institute contributing membership required. Apply for membership.
Key Points from Jack Jones on Automating Quantitative Cyber Risk Analysis
Jack said that automated risk analysis isn’t fundamentally different from the manual version: it still requires a scope (a risk statement with an asset at risk, a threat actor, and some form of impact) and data (for automation those data would be pulled from controls telemetry, audit reporting, asset inventories, logs, vulnerability scans, loss event history and more).
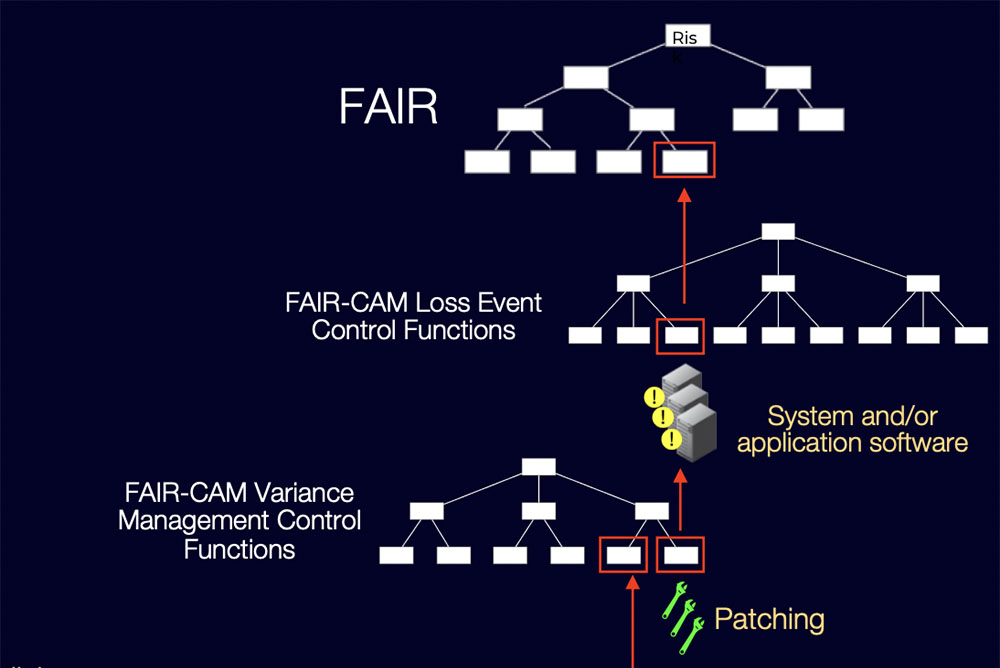
So, there’s plenty of data but to use them requires a model. FAIR-CAM applies what Jack calls “controls physiology” – a systems view of controls – that enables measuring the efficacy and risk reduction value of controls. This physiology is highly complex, a tangle of interdependencies, itself a reason why controls analytics needs to be automated.
Look at this slide for insight on what it takes to answer a seemingly straightforward question: How does patching affect risk?

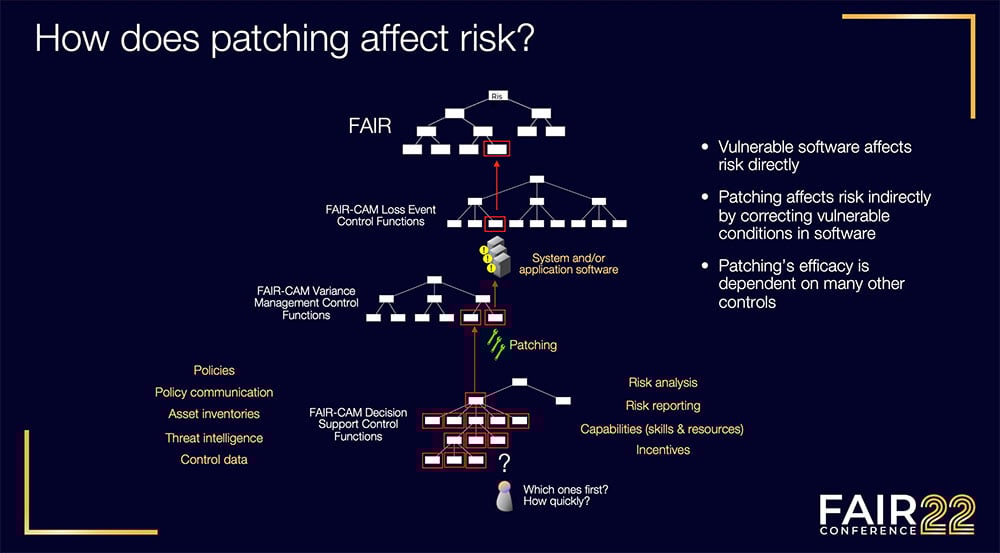
At the top of the slide is risk, the loss exposure generated by analysis with the FAIR (Factor Analysis of Information Risk) model. The factor directly affecting risk in this case is Vulnerability (or Susceptibility).
That’s affected by the vulnerability of the software application in question (see the next step down in FAIR-CAM Loss Event Control Functions) which is determined by the next step down in the Variance Management Control Functions, including patching.
So, patching indirectly affects risk by affecting the vulnerability of some piece of software (in other words, is it exploitable or not). But the efficacy of patching is itself the product of many other factors in the next step down, the organization’s effectiveness on patching policy, asset inventory, risk analysis and reporting, and more. “All these things feed decision making which determines what gets patched when,“ Jack said. “The point is this is a complex set of interdependence. These dependencies are real, and they are empirically measurable.“
“The controls landscape is the most complicated part of our problem space,” Jack said. “Nothing else comes close. So, we’d better understand it.” Without that solid understanding, Jack said, automation just “amplifies the errors that can take place in analysis.”
Learn more about the FAIR Controls Analytics Model (FAIR-CAM)
RiskLens Previews a Tool for Automated FAIR Cyber Risk Analysis
RiskLens (the technical adviser to the FAIR Institute) is working on a new tool for automated FAIR analysis, incorporating FAIR-CAM, with a focus to start on cloud risk categories. CTO Bryan Smith gave a simulated demo of the tool. Given an asset, say a web application, the tool:
- Displays the asset’s position in the network.
- Generates relevant risk scenarios and calculates their probability, per event loss magnitude and annualized loss exposure.
- Displays the many controls that surround the asset, grouped by their FAIR-CAM categories (Loss Event Controls, Variance Management Controls, Decision Support Controls).
- Shows the status of each control (in or out of service or undergoing mitigation) and a readout (in percentage terms) of its efficacy.
- Generates a total annualized risk in dollars for the asset, a probability in percentage terms of the occurrence of the top risk in a year, the top per-event annual loss in dollars, etc.
The tool can also help an organization recognize which control deficiencies are creating the most exposure to loss, as well as whether the associated risk is within management’s risk tolerance and whether it’s necessary to invest time or resources in mitigation.
“We are highlighting a defense-in-depth strategy,” Bryan said, “by showing the inter-relationships. We can show that some controls may be failing all the time. But those may not have that large an impact for the scenarios at play.”
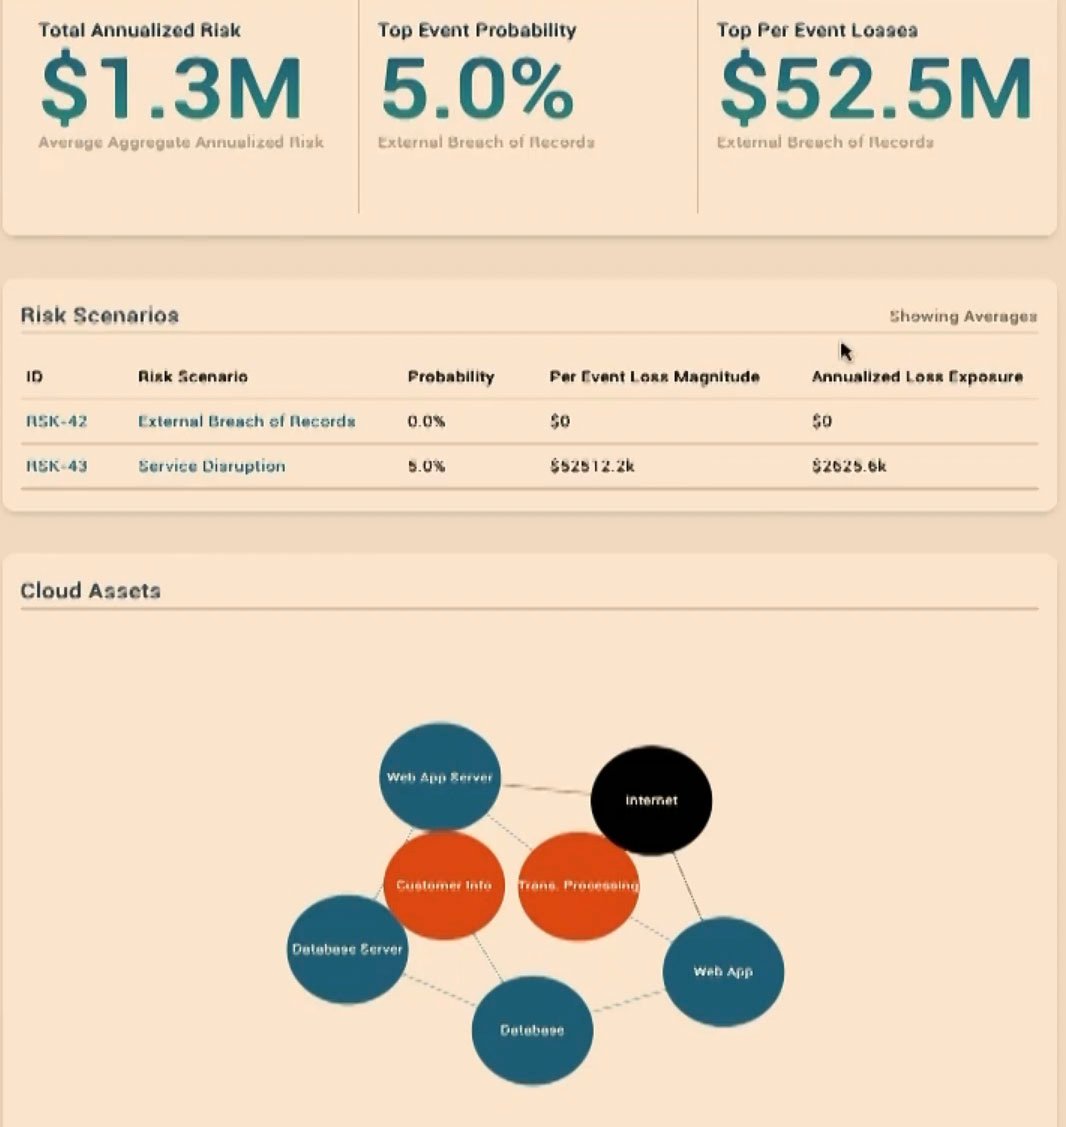
Detail from simulation of FAIR-CAM risk analysis by RiskLens
Watch the FAIRCON session video:
How to Scale FAIR Programs with Controls Analytics
A FAIR Institute contributing membership required. Apply for membership.

-squared-1.png)
.png)


