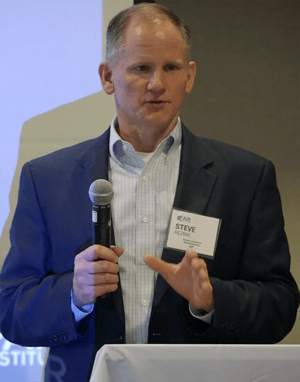
 You’ve tried your hand at running one-off scenarios with FAIR, say to identify your top risks – now learn an ongoing use for FAIR to monitor your key risk indicators (KRIs). At the recent RSA Conference, Steve Reznik, Director, Operational Risk Management, for ADP, gave a hands-on demonstration on building and running a KRI dashboard.
See the presentation: What Makes a Good KRI? Using FAIR to Discover Meaningful Metrics.
Here’s a quick look at Steve’s key points about key risk indicators:
The starting point is the factors in Factor Analysis of Information Risk (see them here), and the objective is identifying which are relatively more important than others for your risk scenarios.
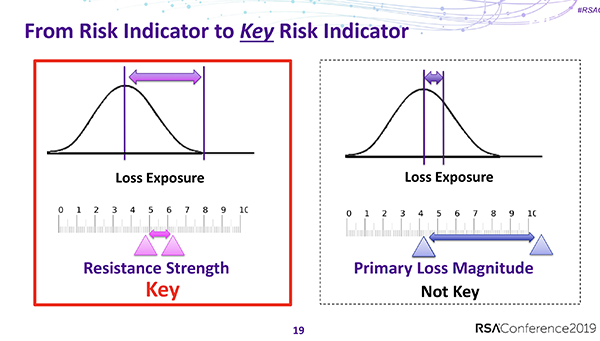
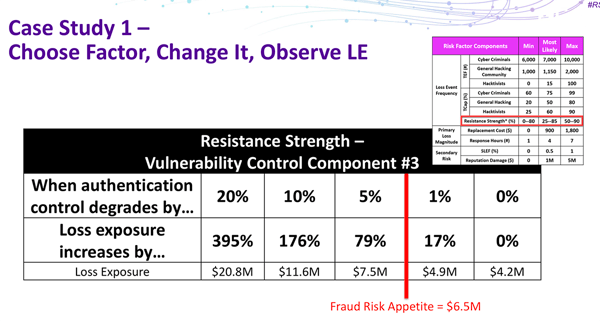
The tool at hand is sensitivity analysis, by which you tweak the results that made up the overall loss exposure generated by your Monte Carlo simulation. For instance, you might degrade Resistance Strength (in other words, weakening the simulated effect of your controls) in the analysis inputs, and seeing by how much your probable loss goes up.
As you can see in the slide, Resistance Strength is relatively more powerful in producing Loss Exposure than another factor, Primary Loss Magnitude, in this analysis. It's a key risk indicator.
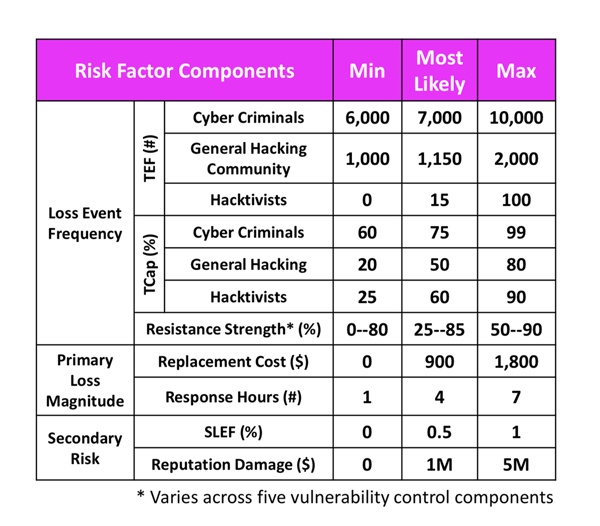
Here’s a blown-out view of a scan for KRIs in a fraud risk scenario. At a glance, you can see that Cyber Criminals emerge as the top threat community, based on scoring high in both Threat Event Frequency (TEF) and Threat Capability (TCap).
 Looking at it another way -- and paying attention to the organization’s risk appetite -- you can see in this chart how degrading the effectiveness of a control runs up the loss exposure; just 5% less effectiveness crosses the appetite level.
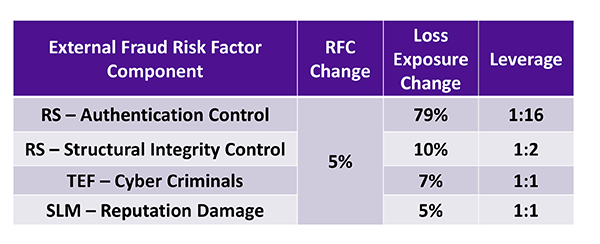
Different factors will raise loss exposure with different strengths, or “leverage”, as Steve puts it.
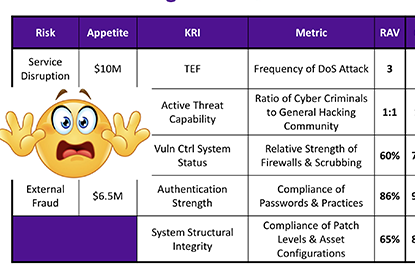
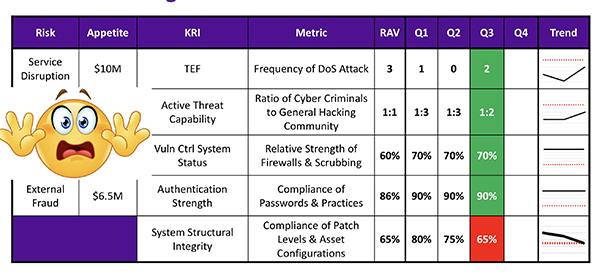
Now, putting it all together into a dashboard (emoji not included)…you can see the key risks, the organization’s appetite in dollars, the identified key risk indicators with their metrics and risk appetite – with System Structural Integrity flashing red because its metric has come in at risk appetite level due to underperformance on patching, a sign of elevated risk.
To sum it all up, Steve says…
Risk indicators should
- Alert on required course corrections
- Reduce the likelihood of unacceptable loss
Key risk indicators should
- Relate to one of the factors of loss exposure
- Have a risk appetite violation threshold
And the ultimate goal is to: identify better metrics.
For more slides and a detailed explanation from Steve watch the video of his talk:
What Makes a Good KRI? Using FAIR to Discover Meaningful Metrics
Learn more: View the RSA 2019 presentation ‘Defining a Cyber-Risk Appetite that Works,' by Jack Jones, chairman of the FAIR Institute.
The FAIR Institute was recently given an award by SC Media as one of the most influential industry organizations of the past 30 years. More than 30% of the Fortune 1,000 companies are represented in our membership – join them and become a member today (it's free to industry professionals).

.jpg)
.jpeg)
.png)
.png)