 I’ve encountered a number of organizations that use guidance provided by special publication NIST’s 800-30 to measure the risk associated with one thing or another. The good news is that 800-30’s underlying concepts and overall approach to risk measurement are very FAIR-like. Even better, although the component names within 800-30 are different from what we use in FAIR, their underlying purpose/intent is similar.
The bad news is that 800-30 will very often generate inaccurate results due to a logical failing in one of its tables. It also has some other challenges which, although not as severe in their effect, set the stage for logically inconsistent and potentially inaccurate results.
In this post, I’ll discuss the most significant of these problems and offer a potential solution that can easily be adopted to improve 800-30’s results.
A logic failure
In order to ensure that we’re all on the same page conceptually, and to illustrate the problem, I’ll talk through a hypothetical scenario analysis.
Let’s say we’re trying to understand how much risk we face from a denial of service (DoS) attack against our website. In order to evaluate the frequency with which our website will experience downtime from these attacks (which 800-30 refers to as “overall likelihood”) we want to estimate two things:
- The likelihood of attacks (which 800-30 refers to as “the likelihood of threat event initiation” in tables G2 and G3)
- The probability that an attack, when it occurs, will result in downtime (which 800-30 refers to as “likelihood of threat event resulting in adverse impacts” in table G4)
When combined, these two elements give you the “overall likelihood” of the adverse event in question. (Note that this is different than the impact of the event, which is evaluated separately.)
Speaking for myself, I find some of NIST’s terminology confusing, but this may simply be because I’m so used to FAIR terms. For those readers who are like me in this regard, the NIST terms map to FAIR terms thusly:
|
NIST 800-30 term |
FAIR equivalent |
|---|---|
|
The likelihood of threat event initiation (table G2 or G3) |
Threat event frequency |
|
The likelihood of threat event resulting in adverse impacts ( table G4) |
Vulnerability |
|
Overall likelihood (derived using table G5) |
Loss event frequency |
With the values chosen from tables G2 (or G3) and G4, you can use table G-5 to derive overall likelihood of the loss event. (The underlying concept here is very nicely aligned with how you derive loss event frequency within FAIR using threat event frequency and vulnerability.) Unfortunately, some of the values within table G5 violate a pretty basic logical principle. I’ll continue with our hypothetical DoS analysis to illustrate the problem.
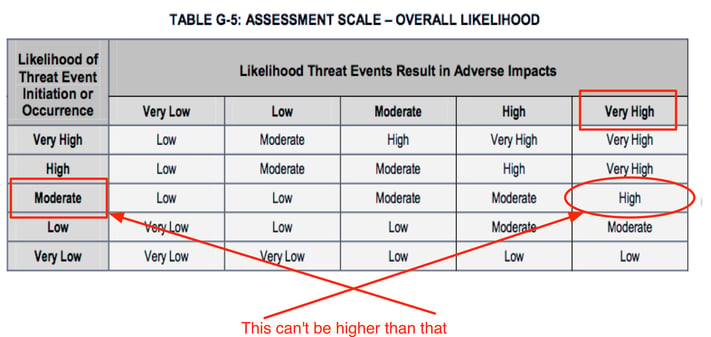
For example, let's say that we're trying to understand how much risk is associated with DoS attacks against our website. We've looked at our logs, spoken with our internal subject matter experts, and selected “Moderate” from table G-2 to as the Likelihood of Threat Event Initiation (DoS attacks) against our website. Then, because our website and network architecture is a bit antiquated, we selected “Very High” for Likelihood Threat Events Result in Adverse Impacts from table G4 to reflect the expectation that when DoS attacks occur they will almost certainly be successful — i.e., we will experience downtime. With these two values, we use table G5 to derive our Overall Likelihood of a loss event as “High”.
On the surface, it might seem to make sense to arrive at an Overall Likelihood of “High” by combining an attack likelihood of “Moderate” with a “Very High” likelihood of an attack being successful. It’s kind of like averaging — but it’s wrong.
So, what’s the problem? Well, table G5 tells us the likelihood of loss occurring was higher than the likelihood of an attack, which isn’t logical or even possible. If the likelihood of an attack is “Moderate”, then there is no way on God’s green earth that the likelihood of loss can be greater than “Moderate”.
In table G5 we see that several of the Overall Likelihood values (outlined in red below) clearly violate this basic logical principle by being larger than the Likelihoods in the left-most column. Even some of those values in the table that don’t obviously violate the principle are inaccurate (e.g., “Moderate” Likelihood of Threat Event Initiation with “Very Low” Likelihood of Threat Event Resulting in Adverse Impacts probably should not result in an Overall Likelihood of “Low”, but rather "Very Low").
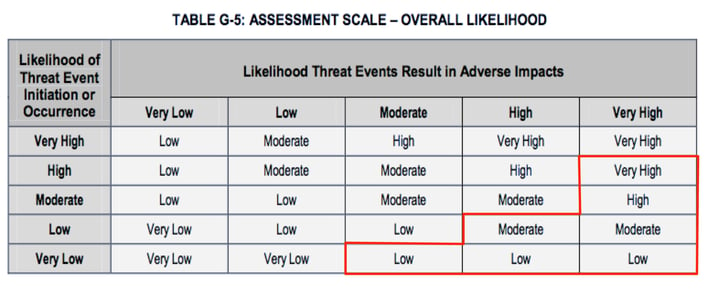
The bottom line is that using table G5 to derive the Overall Likelihood of a loss event will in many cases generate inaccurate results.
An alternative
Okay, so if table G5 is broken what would a “fixed” one look like? I’m glad you asked. Here’s a suggestion:
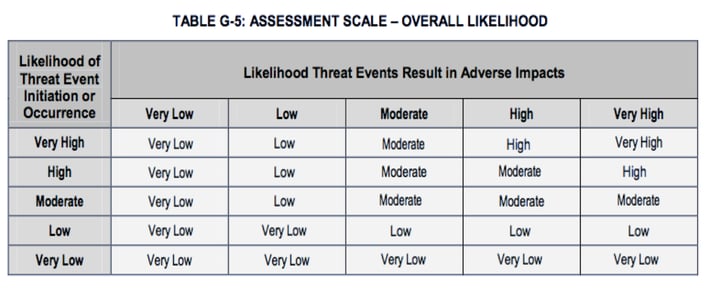
Note that these values were arrived at by multiplying the minimum and maximum values defined for each quantitative range in the G2 and G4 tables, taking the mid-point within the resulting ranges, and then matching that value to the ranges in the G2 and G4 tables. That description may be as clear as mud, so if you want to see the spreadsheet, let me know and I’ll make it available.
Really?
There is a footnote on page G-1 of appendix G in 800-30, which says:
The term likelihood, as discussed in this guideline, is not likelihood in the strict sense of the term; rather, it is a likelihood score. Risk assessors do not define a likelihood function in the statistical sense. Instead, risk assessors assign a score (or likelihood assessment) based on available evidence, experience, and expert judgment. Combinations of factors such as targeting, intent, and capability thus can be used to produce a score representing the likelihood of threat initiation; combinations of factors such as capability and vulnerability severity can be used to produce a score representing the likelihood of adverse impacts; and combinations of these scores can be used to produce an overall likelihood score.
I wouldn’t be surprised if someone countered my criticism of table G5 by referencing that footnote. Something along the lines of; “NIST didn’t mean likelihood likelihood, but more like “kind of like likelihood”.” If anyone offers that excuse, they’d better come prepared to explain a few things:
- The difference between a likelihood “score” and likelihood “in the strict sense” — and they should not plan to rely on “because of available evidence, experience, etc.” as a defense because everything in that line of argument would naturally apply to “likelihood in the strict sense” too.
- Why NIST used a 0 to 100 likelihood scale in its G2, G3 and G4 tables, which logic would suggest equates to likelihood “in the strict sense".
- How the footnote matters in the least with regard to my observations because the likelihood of a loss event can't be greater than the likelihood of an attack.
Unless, of course, they use a different likelihood scoring scale for Overall Likelihood (G5) than the Likelihood of Threat Event Initiation(G2 or G3) — e.g., “Moderate likelihood” would have to mean different things depending on which table you’re referring to. If they did use a different likelihood scale for Overall Likelihood (which would be really hard to imagine and suggests even bigger problems overall), I have three additional questions: 1) what is that scale, 2) what’s the logic behind the different scale, and 3) how is a practitioner supposed to know that difference and explain/defend it to management if questioned about it?
Yes, I know that many in our profession still get nervous about the idea of estimating probabilities, etc., and that footnotes like the one in NIST appendix help them feel unaccountable for their estimates. That’s a cop-out though, and it in no way permits a violation of fundamental logic.
Summary
Despite some of the good stuff within NIST 800-30, the way that table G5 is constructed makes it likely to generate inaccurate risk measurements. For that reason, I hope that NIST will consider making changes along the lines of what I’ve described — or at least explain their rationale in a way that stands up logically. Regardless, at least you are now aware of the issue and have the option of adopting a revised G5 table.
BTW — although this is the most significant problem within 800-30, it isn’t the only problem. In the interest of brevity I’ve chosen to leave discussion regarding the other problems for another time. Regardless, you can avoid these problems altogether by adopting the FAIR standard and applying some basic logic. Just sayin’…
**Due to some of the comments below, I’ve written a follow-up blog post, which can be found here: https://www.fairinstitute.org/blog/examining-a-defense-of-nist-800-30**