I have posted on YouTube 13 Reasons Why Heat Maps Must Die, a presentation that I prepared for a conference. My eight year old daughter already commented “Amazing work, I agree.” What more validation does one need?
Since not everyone has the time to watch a 45-minute presentation, I’m giving you here a quick rundown of the main points.
Seeing is believing. Sometimes it’s just easier to show people how easy it is to do quantitative risk management than going through the model, etc. , while the audience keeps thinking “Quantitative risk management is too complex, it needs lots of data…”. I did that in the presentation, so you might want to check it out.
Now we move into the 13 reasons why we need to kill off heat maps, as a way to measure and represent risk.
1. Willful Ignorance
When we are confronted with inconsistencies in qualitative risk management or have no real answers, we typically say something like “yes, but risk management is really more art than science.” I believe it is so by choice or by design. We could have tipped the scale and made it more science than art, but that’s not what we did. There is so much knowledge on the topic to build on top of, but heat maps pretend it doesn’t exist. And sincerest apologies to anyone or their descendants that I missed in the below graphic. Can you name everyone in that image below?
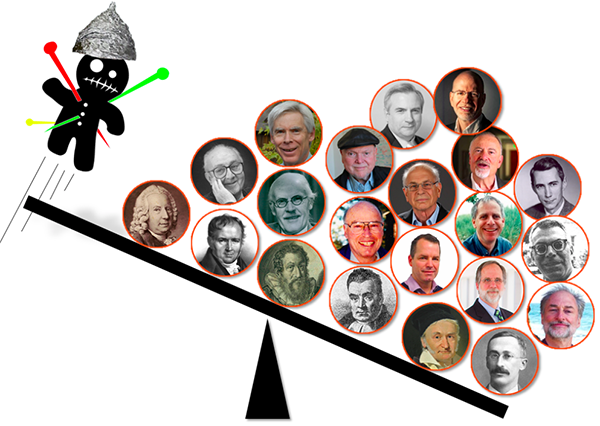
There is no evidence of the value of heat maps -- to the contrary, there is sufficient evidence to show they are flawed.
2. Fake NewsMath
We can’t do the math on ordinal scales. We should not fool ourselves that we do that for the sake of simplification. If the result is useless, then that is not a defensible simplification. The consequences of this are illustrated using the arbitrary ranking example from “The Risk of Using Risk Matrices” and the range compression problem from “How to Measure Anything in Cybersecurity Risk.”
3. Models
Models are used everywhere, from anthropology to zoology, just not in qualitative risk management. The science on that is clear, we do far better when we use formal models. The more recent evidence of this is the work of Philip Tetlock, but many before him have made the same conclusions in smaller studies.
On the value of models, one realization I made is that we don’t learn anything using heat maps. Has anyone ever been surprised by the result of a risk analysis using heat maps? They don’t inform our decision making, they retrospectively justify decisions that we have already taken (consciously or unconsciously). In contrast, a good model that forces us to think about the assumptions helps us overcome our biases and preconceived notions.
The other value of models is how it transforms the risk analysis from an endless debate of people with entrenched positions talking at each other to true collaboration where people work together to find the best data and how best to use it. Raw data is void of personal interpretation.

4. Ignoring Uncertainty
When we pick a range for likelihood or consequence from a risk matrix, does anyone ask how confident we are in that choice? With every risk analysis, we are saying that we have the same confidence in our “estimates.” That just doesn’t make sense. (It does not matter anyhow since that choice is followed by fake math).
The other point is that, using heat maps, folks typically rely on singular data points, such as a particular single event and not the full range of probable loss events. I haven’t seen a risk management procedure that actually spells out which scenario is being thought of when picking a pre-defined range in a risk matrix. Best case, most likely case or worst case? It doesn’t matter, whichever scenario you pick you are still ignoring all the other probable events.
5. Expert Judgement
Here we are making a case for the importance of calibration training. Qualitative risk management pretends experts are infallible. They never got a second opinion from a doctor followed by a third. Subject matter experts are only human after all. Quantitative risk management knows the limitations of subject-matter experts’ judgments and chooses to compensate for that.
6. Arbitrary Scales or Scale Response Psychology
Another case of willful ignorance. There is no shortage of research on how our choices in scale design impact the result. Quantitative risk management does not use scales.
7. Human Bias
Our rationality has its limitations. Qualitative risk management chooses to ignore that. Quantitative risk management recognizes itself as a decision-making discipline and welcomes contributions from other domains. Behavioral economics is one such domain. Significant contributions have been made in this field worthy of two Nobel prizes. Heat maps don't value benefiting from these insights.
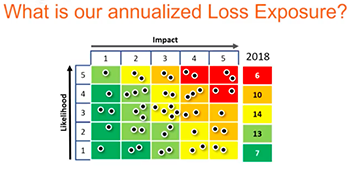 8. Risk Aggregation
Business is interested in understanding what cyber risks it is facing this year, next year, to a particular business line or asset and not in every single risk in isolation. There is no meaningful way to aggregate risk using heat maps! Full stop.
9. Risk Communication
Anyone trying to take a heat map seriously will have more questions than answers. Heat maps are risk management theatre and an illusion that communication is taking place. Quantitative risk management is transparent; it does not obscure, it does not hide anything from the decision makers.
10. Risk Treatment
Risk analysis using heat maps usually ends up with two recommendations, one to do nothing and the other to do something. The risk analyst’s “gut feeling”, knowing what’s best for the business, has already steered the analysis in one of these directions. Let’s pretend you are using heat maps and are actually suggesting multiple treatment options. How does the heat map help us making a decision on which one is the best option? It doesn’t. Quantitative risk management provides clear guidance on what expenditure is or isn’t justified. This is cyber risk economics at work.
11. Sensitivity Analysis
With heat maps, one might do some basic “what if” scenarios to see if we should focus on reducing likelihood or impact. Of course, risk is a function of other variables as well, and here quantitative risk management and sensitivity analysis shine. It’s easy to conduct a sensitivity analysis and use tornado charts to help guide our efforts.
|
|
 Osama Salah
12. Skillset
Qualitative risk management has this attitude that anyone can do it. It does not matter if we do the wrong things as documented in some procedure or not; thus, skills don’t matter when using heat maps. Quantitive risk management values critical thinking, understanding of basic probability theory, calibrated estimation training, behavioral economics, understanding data quality and so much more. A wide range of skills are valued, and none of them are complicated or difficult to master. (Read this: What Makes a Good Risk Analyst?)
13. Continuous Improvement
Peter Drucker said, “You can’t manage what you don’t measure.” Do I have to say more?
Some loss events have a very low frequency; we never get to learn from experience. The feedback loops can be very lengthy; thus, it’s essential we start with the right foundation. With heat maps, we fail to recognize feedback when it occurs because of our shallow understanding of our problem space and when it occurs we ignore it because it does not align with our preconceived notions.
Quantitative risk management conducted with risk model such as FAIR specifically focus on understanding the actual problem and decomposing it into its building blocks. A clear understanding of these building blocks or variables that contribute to risk makes it easier to monitor them and to detect changes when they occur.
Models like FAIR make it easier to identify possible Key Risk Indicators as the variables that make up risk are clearly defined.
And this concludes the list of reasons why we need to give up on heat maps. If you have any other good reasons to share, please do so in the comments area.