


![]() Have you ever looked at the results of a FAIR risk analysis and wondered what's the probability that a loss will hit the max? Or looked at the results and tried to answer how much risk you are comfortable with? If so, the new Loss Exceedance Charts introduced in the latest release of FAIR-U are your answer.
Have you ever looked at the results of a FAIR risk analysis and wondered what's the probability that a loss will hit the max? Or looked at the results and tried to answer how much risk you are comfortable with? If so, the new Loss Exceedance Charts introduced in the latest release of FAIR-U are your answer.
FAIR-U is the officially sanctioned training web application for running FAIR risk analyses. The tool is offered free of charge by RiskLens, Technical Advisor to the FAIR Institute.
Create a FAIR-U account and start using the application now.
A Loss Exceedance Chart (LEC) is a way to visualize the probability of the loss exceeding a certain amount. LECs show the results (as a loss exceedance curve or exceedance probability curve) of applying Monte Carlo simulations to a FAIR risk analysis.
Reading a Loss Exceedance Curve Chart
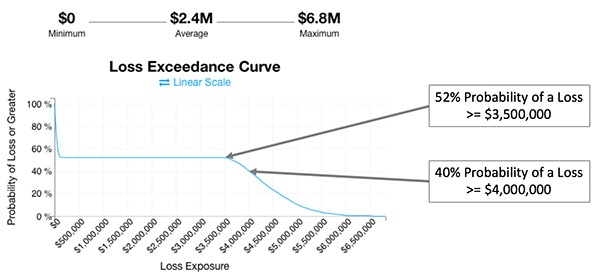
The x-axis plots the annualized loss exposure for the given risk scenario considered in the analysis. The y-axis plots the probability of a loss being greater than the intersection with the x-axis, from 0 to 100%.
FAIR-U calculates Probability of Loss from the results of the Monte Carlo simulations. It does this by analyzing the range of results and finding the percent of values that are greater than or equal to segments of the range.
Using Loss Exceedance Charts for Business Decisions
The chart above represents annualized loss exposure between $0 and $6.8M. As a decision maker, how do you know what to plan for? What can this data tell you? Loss Exceedance Charts guide you to decisions by asking how comfortable you are with loss.
Start asking questions such as, “Our cyber security insurance covers incidents up to $3.5M. What is the probability that the loss will be greater than that?” The LEC can be quickly used to see that the probability is 52%. Are you comfortable with a 50/50 probability of loss being greater than $3.5M? Maybe you are, but what about something bigger?
What about greater than $4M? You might not be comfortable with this large of an amount. The probability is 40%. Are you uncomfortable with a 2 in 5 possibility of losses being greater than $4M?
This process helps you determine your comfort level of loss (or risk appetite) given a risk scenario. If you're not comfortable with the level and probability of loss, then you know it is time to start addressing what risk mitigation techniques can help lower the exposure.
New to FAIR? The 2018 FAIR Conference is a great opportunity to learn quantitative risk analysis for cyber and operational risk, and meet FAIR risk quantification practitioners.

-squared-1.png)
.png)


