


Longtime FAIR practitioner and advocate Tony Martin-Vegue previews his new book From Heatmaps to Histograms: A Practical Guide to Cyber Risk Quantification.
In this blog post, Tony covers key themes from the book:
- Why CRQ Still Feels Hard (And How We Can Make It Easier)
- A Practical, Three-Source Approach to Data
- Building CRQ as a Repeatable Craft
- AI as a Partner in Quantification
- Three Practical Techniques You Can Use Today
- Moving CRQ Forward Together
 It began the way many meaningful risk conversations begin. A competitor reported a ransomware incident. Same industry, same cloud stack, same size. Their platform was down for several days, customers complained, and media outlets speculated about the financial impact.
Within minutes, our CFO forwarded me the news with a short message asking whether something similar could happen to us, and what it might cost.
That moment appears early in my new book, From Heatmaps to Histograms: A Practical Guide to Cyber Risk Quantification. I included it because it captures something many of us in the FAIR community experience often: the need to turn a vague but important question into a clear, defensible forecast that can support a decision.
The FAIR Institute has done remarkable work over the last decade bringing quantitative thinking into the mainstream. FAIR’s definitions, decomposition, and model continue to be the backbone of modern cyber risk measurement.
The book I’ve written aims to complement and extend that work by focusing on the parts that practitioners consistently tell me they need more help with:
- Scoping
- Data
- SME ranges
- Communication
- and the practical realities of running analyses day to day.
FAIR has given us a shared language. What many teams still look for is the practical instruction that turns that language into a routine, confident practice.
Why CRQ Still Feels Hard (And How We Can Make It Easier)
As FAIR has grown, something encouraging has happened. More teams are running quantitative analyses, and they are doing so earlier in the risk program building process. Along the way, they keep asking thoughtful questions:
- How do I gather the right data?
- How do I elicit good SME ranges? When do I know I have enough evidence?
- How transparent should I be about uncertainty?
These are good questions, and they are signs of maturity, not dysfunction. They reflect a community that is moving from understanding FAIR conceptually to applying it consistently.
In my experience, teams usually struggle not with the FAIR model, but with the scaffolding around it. For example:
- Breaking a scenario down to something truly measurable
- Identifying the minimum information needed to make progress
- Distinguishing between strong data, weak data, and weakly correlated signals
- Running elicitation sessions in a structured, repeatable way
- Blending evidence without overconfidence
- Preparing results so decision-makers can act with clarity
- Leveraging AI in a defensible and credible way
None of this contradicts FAIR. It simply adds the connective tissue practitioners need in order to use FAIR well under real-world constraints.
A Practical, Three-Source Approach to Data
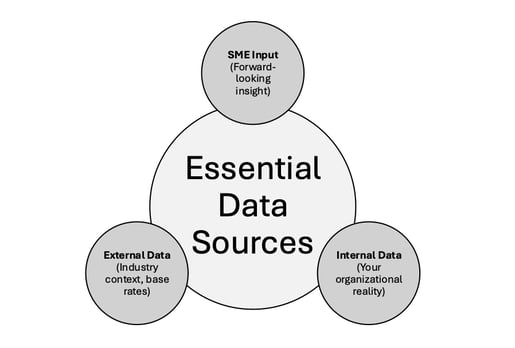
One idea that has helped many teams is a simple organizing principle for evidence: external data, internal data, and subject-matter expertise.
Every analysis relies on some combination of these three. The order does not matter, and completeness is not required. What matters is that each source is gathered intentionally, assessed for quality, and blended with the others in a transparent way.
- External data gives you a starting point.
- Internal data shows how your environment differs from the population.
- Subject-matter expertise adds forward-looking context that no dataset can capture on its own.
This is Bayesian reasoning in practice, though not in the mathematical sense. It is a way of updating beliefs as new information arrives, and documenting how your thinking changes along the way. Many analysts find that this approach reduces uncertainty rather than amplifying it. The goal is not perfection; the goal is to be consistently less wrong.
Building CRQ as a Repeatable Craft
When I wrote the book, I wanted to avoid treating CRQ as a collection of disconnected techniques. Instead, I tried to show how the pieces fit together in a workflow that feels natural, even for analysts who are new to quantitative work.
That means starting with a clear scenario, identifying the smallest set of information needed, gathering it from multiple sources, adjusting for quality, blending evidence into ranges, modeling those ranges, testing what-if cases, and finally communicating results in a way that ties directly to a decision.
All of this is compatible with the FAIR model. The intent is to help practitioners navigate the early and middle steps so the final outputs genuinely serve the decisions they were meant to inform
AI as a Partner in Quantification
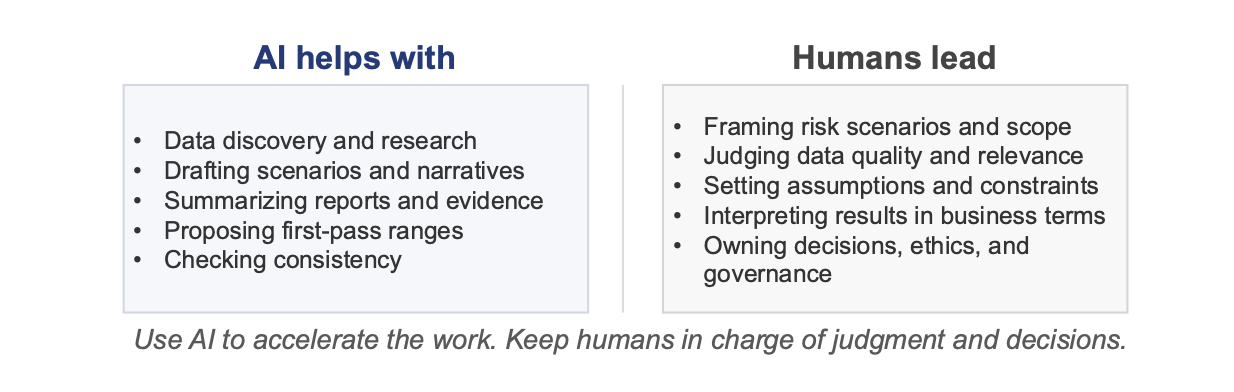
One major theme in the book is the role of AI in CRQ work. Many teams are experimenting with large language models, and the potential benefits are enormous: assistance with data discovery, early analysis drafts, scenario framing, research summaries, and quality checks.
But as with any powerful tool, there are guardrails. The advice in the book focuses on using AI responsibly and transparently, pairing automation with human judgment, and understanding where AI helps and where it cannot replace expertise. Much like FAIR itself, AI is most effective when it supports decision-making rather than trying to replace it.
A recurring message in the book is that AI will change the work of risk analysis, but it will not replace the analyst. It will amplify the importance of good framing, careful reasoning, and sound judgment. Those are very human skills.
Three Practical Techniques You Can Use Today
To keep this grounded, here are three techniques from the book that teams can begin using immediately.
- Minimum viable quantification
You do not need every data source before starting. One external base rate, one internal signal, and one informed SME range can be enough to produce a first pass. The value is in iterating. - Structured SME elicitation
Never ask for a single number. Ask for a low, typical, and high estimate, and ask what changes as the expert shifts their assumptions. This uncovers hidden variables and reduces anchoring. - Think in terms of influence
Before collecting data, sketch a simple influence diagram. Start with the decision to support, then map backward to the single quantity you need to estimate, and only then identify which inputs affect it. This prevents unnecessary data collection and keeps analyses focused.
Moving CRQ Forward Together
FAIR has brought modern risk reasoning into the mainstream and given analysts a shared foundation. The next step for our community is to continue refining how we apply these ideas in practice, especially as data sources evolve and AI reshapes the way analytical work is done.
From Heatmaps to Histograms was written as a contribution to that ongoing conversation. My hope is that it helps practitioners build confidence, bring clarity to decisions, and take full advantage of both traditional CRQ techniques and the new capabilities emerging through AI.
If you would like to explore these ideas in more depth, From Heatmaps to Histograms will be available in early March and available for preorder now. Preorders truly help first-time authors. They signal interest to publishers and retailers and help the book reach the people who need it. You can:
- Preorder the book now
- Subscribe to my newsletter for excerpts and ongoing CRQ content

-squared-1.png)
.png)


