As a FAIR consultant, I have seen many organizations go through the transformation from qualitative to quantitative risk management. Often what I have found is that the transition from a world of no numbers (or very few numbers) to the quantitative risk world of numbers galore can be a little daunting. With so many numbers to choose from, how do you keep them all straight and decide which number(s) to focus on for reporting?
The consulting answer is it depends. And while that is true, here are some helpful tips to steer your next analysis presentation towards success.
Know Your Stats
In order to create a presentation that resonates well, the first step is to know your stats inside and out. This means not only knowing the numbers, but what they represent and how they were derived/estimated.
In FAIR analysis, we report on two types of stats: Annualized Loss Exposure (ALE) and Event-Based (Non-Annualized) Loss Exposure.
Note: For illustration purposes, I'm showing results here generated by the RiskLens platform.
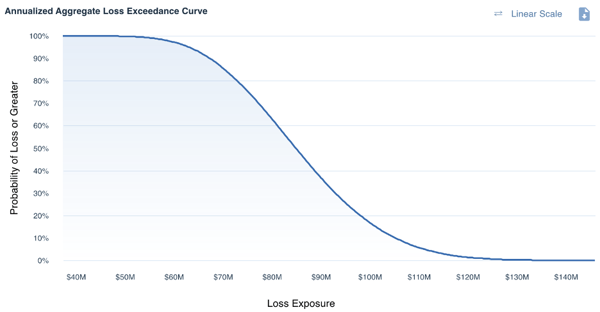
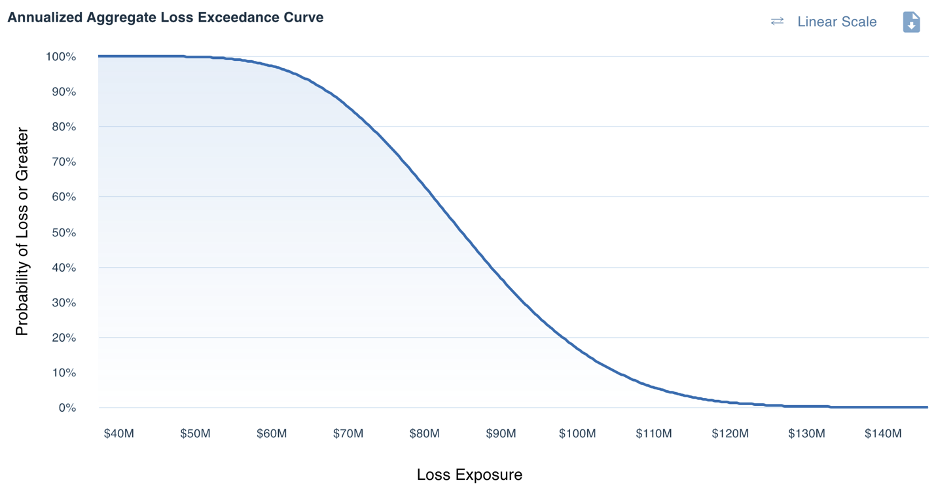
Annualized Loss Exposure (ALE)
Measures of Annualized Loss Exposure (ALE) are useful when comparing multiple risk scenarios and/or prioritizing remediation efforts. They can also be helpful on an individual analysis level if the Loss Event Frequency is greater than one time per year, as they allow you to understand the sum effect of all Loss Events in the given year.
Key Annualized Loss Exposure Stats:
>>Minimum / Maximum – the minimum/maximum values of the ALE distribution represent the absolute lowest and highest iteration result, respectively. For example, a minimum value of $0 would represent that in at least one simulated year, the Loss Event did not occur.
Practitioner’s Tip: When referencing the Maximum value, it is important to caveat that while this value is possible, it is likely not a probable outcome and as such, should be evaluated in that context.
>>Average – the average value of the ALE distribution represents the statistical mean.
Practitioner’s Tip: It is important to keep in mind that the Average value is influenced by outliers in the distribution. If using this value outside of a Normal Distribution, you should always point out any outlier values (i.e., a significant max) for full transparency.
>>Most Likely – depending on your Quantitative Risk Analysis method, you may also be calculating the Most Likely value, or essentially the Mode of the distribution. This value represents the amount of Annualized Loss Exposure that occurred most frequently in the simulated results. Similar to the Minimum value, a Most Likely value of $0 would represent that in the majority of simulated years, the Loss Event did not occur, either due to lack of attempts or low Vulnerability.
>>10th / 90th Percentile – the 10th and 90th percentiles create a boundary to show where 80% of the simulated results fell. In the example above, a 10th percentile of $67.3M and 90th percentile of $105.2M means that there is an 80% chance that in a given year the Loss Exposure will be between $67.3M and $105.2M.
Practitioner’s Tip: 10th and 90th percentiles can be great ways to illustrate the effect of outliers on a distribution. In the above example, where the Maximum value is $145.7M but the 90th percentile is only $105.2M, it can be useful to focus instead on the 90th percentile as the “highest probable value” while adding the caveat that in the worst case it could be as high as $145.7M.
Event-Based (Non-Annualized) Loss Exposure
In risk scenarios that occur less than one time per year and/or are not being used for comparison, it may be more beneficial to focus on the per-event values. These values show the Loss Event Frequency (LEF) and Loss Magnitude (LM) independent from one another and can sometimes provide additional clarity to ALE values.
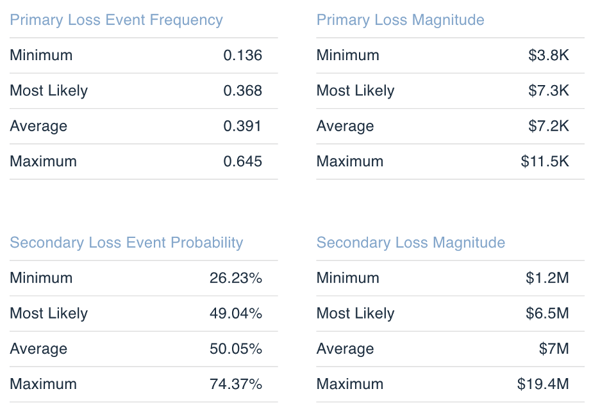
Key Event Based (Non-Annualized) Stats:
Primary Loss Event Frequency (Loss Events Per Year)
>>Minimum/Maximum – the absolute Minimum/ Maximum number of times the Loss Event is expected to occur in a given year (independent of the extent of the loss).
>>Average – the statistical mean of the data set. This represents on average how many times you can expect the Loss Event to occur per year. Similarly, to the ALE values, keep in mind this is influenced by outliers.
>>Most Likely – the mode or most likely number of times per year you can expect the Loss Event to occur.
Practitioner’s Tip: This is a great value to use to Q/A your analysis. If, based on your data gathering, the number of times per year you expected was between 1 – 5 and you end up with a Most Likely value of 7, you know something went wrong in your data entry or calculation!
Note: a decimal represents the Loss Event is expected to occur less than one time per year. For example, a value of 0.1 should be interpreted as the Loss Event occurring once in every ten years or a 10% chance of the Loss Event occurring per year.
Secondary Loss Event Probability (Likelihood of experiencing secondary losses)
These values are communicating the probability that there will be additional secondary losses when the loss event occurs.
>>Minimum/Maximum – the absolute Minimum/ Maximum probability that the additional secondary losses will occur when the loss event happens
>>Average – the statistical mean of the data set. This represents on average the probability that the additional secondary losses will occur when the loss event happens . Similarly, to the ALE values, keep in mind this is influenced by outliers.
>>Most Likely – the mode or most likely number probability that the additional secondary losses will occur when the loss event happens
Loss Magnitude Per Event (applies to both Primary and Secondary table above)
>>Minimum/Maximum – the absolute minimum/maximum Loss Magnitude expected (per event).
>>Average – the statistical mean of the data set or the average amount of Loss Magnitude expected (per event).
>>Most Likely – the mode or most likely amount of Loss Magnitude expected (per event).
Practitioner’s Tip: It is always important to emphasize the fact that these values are on a per event basis. This means that if the Loss Event occurs 4 times per year, it could theoretically have an Annualized Loss Exposure of 4x the Maximum value of per event Loss Magnitude.
Tips on Presenting the Numbers
Know your Audience
It is always imperative to keep your audience in mind when developing presentations. For example, for a higher-ranking audience, you may choose to provide more higher-level strategic information such as the Most Likely Annualized Loss Exposure rather than specific details. Additionally, the risk adverseness of your audience may impact your reporting as well. For example, if I know my audience is particularly risk adverse, I may choose to first emphasize the 90th percentile of ALE and then provide the Minimum/Maximum/Most Likely values subsequently rather than focusing on the full range from the beginning.
Keep it Simple, Stupid (KISS)
Aside from one of the few instances you can call someone (or yourself) stupid at work and not be the office bully, this mantra can also be used to keep your quantitative risk analysis presentations in the appropriate guardrails. In order to keep it simple, always try to tell the story of the analysis: articulating the three P’s: Purpose, Process, and Product.
>>What was the purpose of this analysis?
>>What process/estimates did we use to derive these values?
>>What was the product/result of the analysis?
>>What decision should/is being made?
You can always add additional information to the appendix but keep the actual presentation short and sweet and always keep your audience in mind.
Learn more:
Primary vs. Secondary Loss in FAIR™ Analysis: What's the Difference and Why It Matters
A Crash Course on Capturing Loss Magnitude with the FAIR Model

.jpeg)
.png)
.png)