


When one hears about challenges in cyber risk quantifications, many topics such as reporting, data sourcing, budget, etc. may come to mind, but one of the most challenging aspects is scenario scoping, i.e., identifying which risk scenarios (or loss events) to measure. This challenge can be solved by following the framework below.
Risk Identification: Usually this starts with a stakeholder, or decision maker asking about a risk problem. This might be a simple question like “how much risk is associated if we implement XYZ,” or something more complicated relating to a control weakness or vulnerability analysis.
 Raksha Shenoy is an Information Security Engineer (Cyber Risk Quantification) at Equinix, the global data centers company.
The FAIR Institute welcomes contributions to our blog from our expert members - contact us.
A pattern I have noticed during the risk identification phase with stakeholders is the instinct to push for a certain risk scenario. It usually is one involving an external malicious actor, mainly because they can think of a worst-case loss event relating to that risk scenario. However, that is not always the one where the actual loss exposure is, which is why identifying the most probable risk scenarios to measure is the most crucial step in performing quantitative risk assessments.
This blog post will cover the recommended steps to identify the most probable risk scenarios worth measuring.
1. Context
The first and most obvious step is to gather relevant context with regards to the risk problem at hand. This step may require talking to SMEs to gather information as well as good old research, and industry data. The main goal of this step is to understand what assets are in scope for this risk problem (mainly gathered from knowledgeable SMEs) as well as which threat actors and loss effects are in scope (gathered from SMEs and research).
 Becoming FAIR Trained and Certified will change how you, your team, and your organization view and act on risk. Learn more about FAIR training.
2. Scope
The output of the context step will likely be a list of assets, threat actors, and loss effects. A quick mapping of this will produce a list of all possible risk scenarios that are in scope for the risk problem. However, it is very important we focus on and measure only the most probable scenarios versus all possible scenarios as this is what will most help decision-makers.
3. Loss Flow Diagrams
The third step and the one I consider to be the most important is to understand how loss will unfold for the possible scenarios at hand. A loss flow diagram is a high-level visual that considers the threat actor, type, asset, and loss effect, and shows how loss can materialize at every step, while also considering the controls that are in place or lack thereof that may change the frequency/impact of the risk scenario.
This may seem a bit tedious especially if you are working with a long list of possible scenarios, but I have found that most times, a loss flow diagram for one scenario can help you eliminate many other possible risk scenarios. For example, an entire asset may be considered out of scope when drawing out the loss flow diagram because there are multiple strong asset level controls in place versus another asset where there are none, (again, focusing on probable vs possible). This may also be true for a threat actor: One threat actor maybe more probable for the problem at hand versus another based on the method and controls in place.

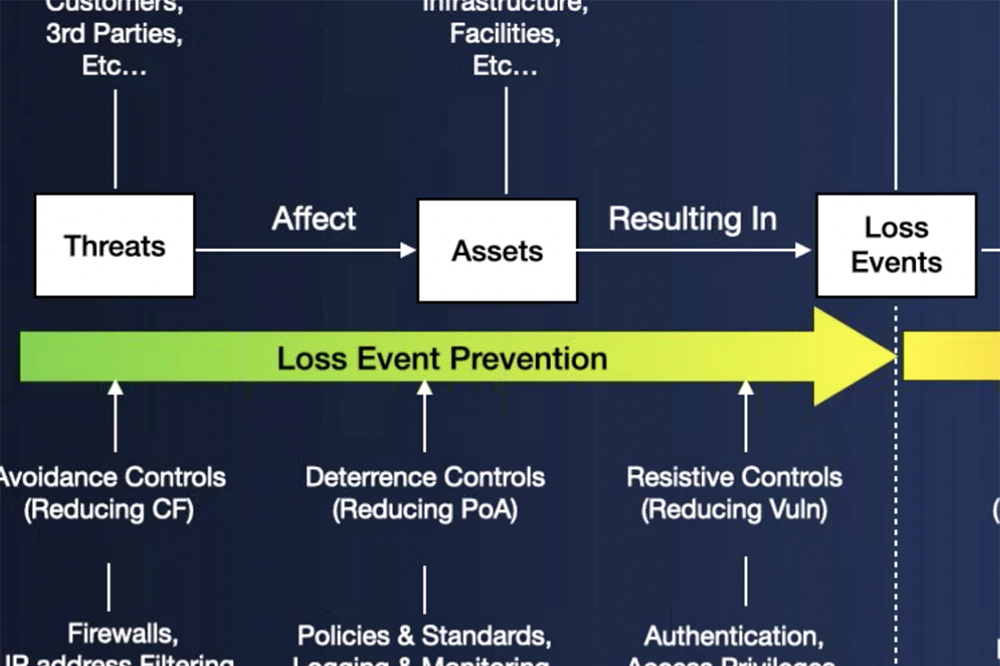
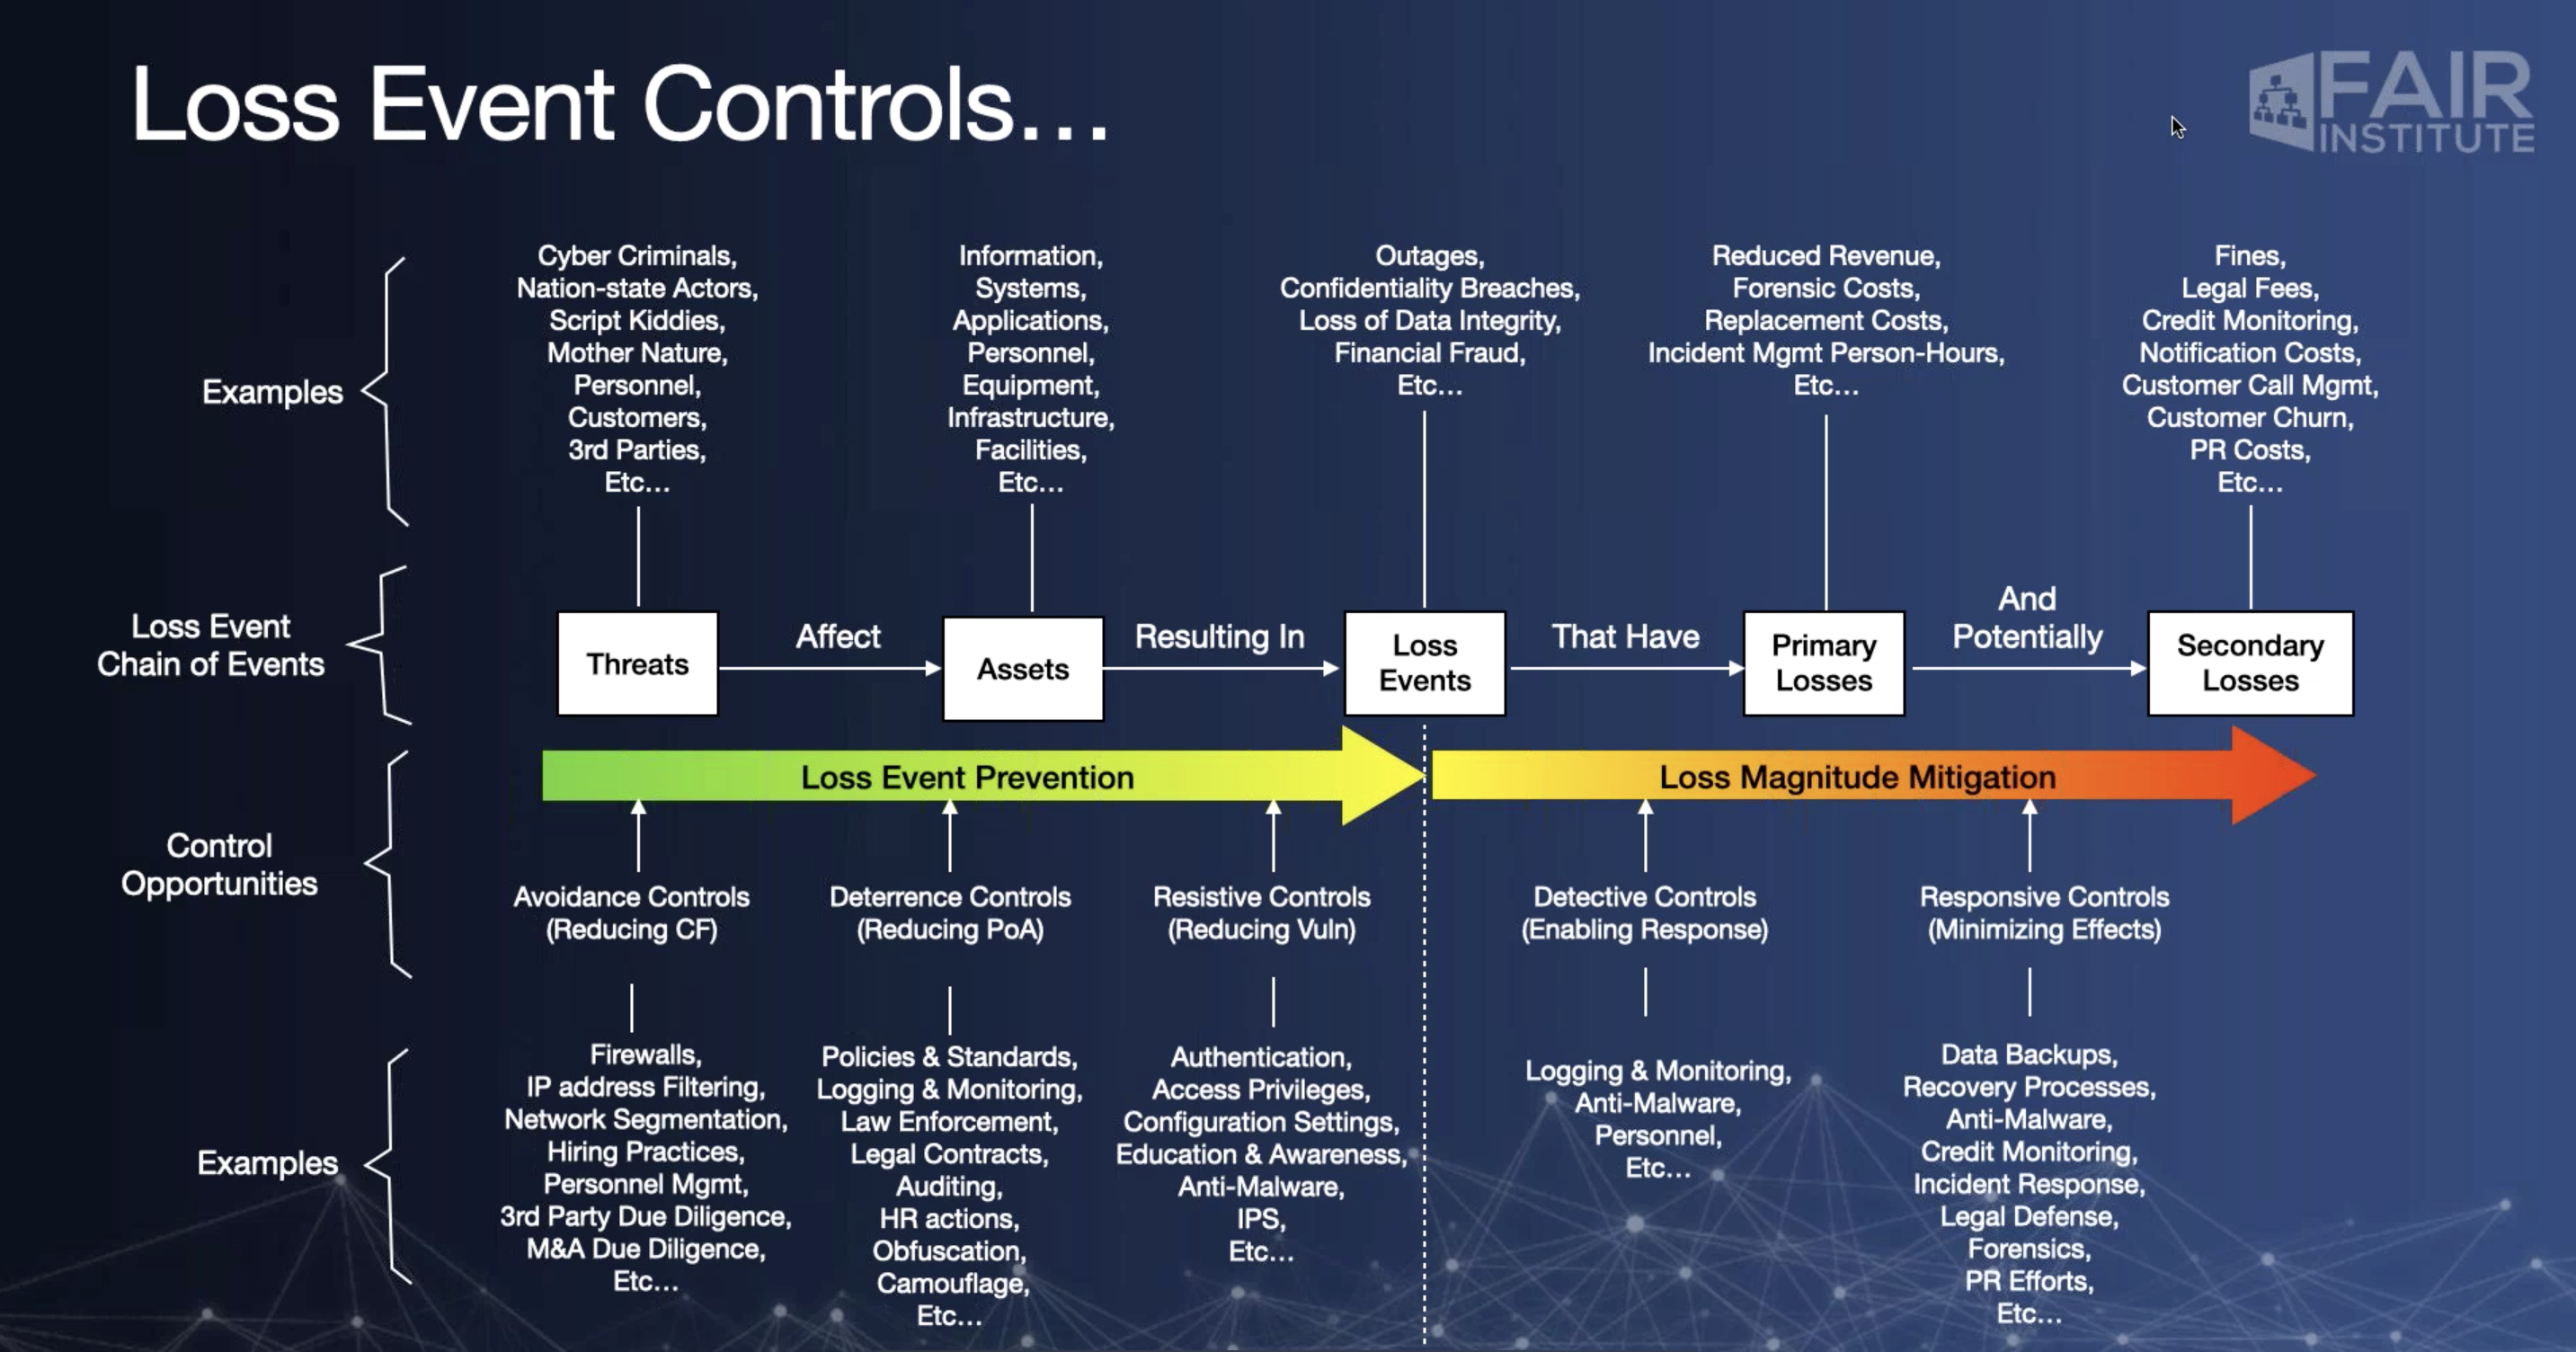
Loss Event Chain of Events from the FAIR Controls Analytics Model (FAIR-CAM™). For more detail, click to see the entire chart.
Even though it can seem like a long process at first, it's best to spend the most time scoping scenarios, versus going back later to make a course correction or trying to measure risk for all possible scenarios. As mentioned above, the external actor usually seems to be the main concern of stakeholders, however taking a step back and following the above framework can help identify the scenarios with the greater loss exposure.
For example, the risk problem may be around an external malicious actor getting access to sensitive data through a particular method. Following the steps outlined above may make it clear that an insider continuously making errors, when unresolved, is what opens the particular method to be exploited by an external actor. Once the insider scenario is recognized as a probable scenario and a FAIR analysis is completed, the results may show the response costs for the insider making an error multiple times a year significantly outweighs the losses of the scary external actor. Hence, following the above framework can help identify the most probable risk scenarios worth measuring.
Related:
How a Risk Analysis Scope Gets Off Track (and How to Fix It)
Starting Off on the Right Foot: How to Clearly Define a Risk Scenario Statement for FAIR Analysis


