


 In the previous two posts, I briefly discussed that:
- The CRQ market is rapidly growing, and there’s a strong desire to automate CRQ analysis...
- Accuracy is crucial for CRQ automation solutions, else they can do more harm than good, and...
- There are three dimensions of analysis that CRQ solutions must do well in order to have accurate results
I also discussed the first of those dimensions, scoping. This post is all about the second dimension, modeling, and its challenges.
 Jack Jones is the creator of FAIR™ (Factor Analysis of Information Risk), the international standard for quantification of cyber, technology and operational risk, as well as the FAIR Controls Analytics Model (FAIR-CAM™) that quantifies how controls affect the frequency and magnitude of risk.
Models
Models describe the parameters that feed our analysis, as well as how they relate to one another. This is where formulas come into play, and if the models are fundamentally flawed, analysis results are going to be unreliable.
The good news is that the basic formula for FAIR is well known and vetted. The less-fortunate news is that the FAIR model — by itself — does not fully support automation. Specifically, it hasn’t included a formulaic way to account for how controls affect risk. Instead, it has relied upon the expertise of personnel performing analyses to understand which controls are relevant to an analysis and how they affect risk.
Consequently, any automated CRQ solution will invariably bolt on additional sub-models and formulas to “improve” FAIR in this dimension, and this is where things get… interesting. As the old mariner maps supposedly used to say, “Here there be dragons.”
But why is controls modeling problematic? After all, don’t controls boil down to reducing the frequency or magnitude of loss? Yes, but the devil is in the details. If we don’t understand and account for the mechanisms by which controls affect risk, then the analytic results won’t be accurate, and we won’t be able to make good decisions.
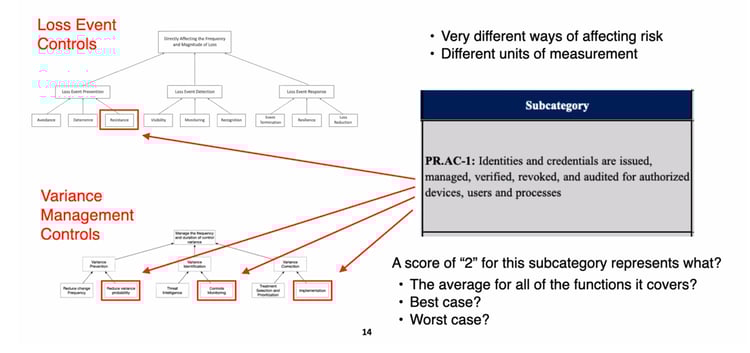
From the FAIR-CAM White Paper
The controls landscape is the most nuanced and complex component of an analysis. For example, how much less risk does an organization have if it has a good set of policies?
To answer that we first must understand how policies affect risk. I once had a heated argument with a colleague who insisted that policies are a resistive control. They aren’t. They improve the reliability of other controls (including detection and response controls) by clarifying expectations and reducing the odds of personnel making mistakes. But policies, by themselves, don’t reduce risk meaningfully, if at all. They also have to be communicated (which is a separate control) to personnel before their value can be realized. So, in that relatively simple example, it’s clear that:
- Policies do not affect risk directly, but rather through their effect on other controls, and
- Their efficacy is dependent on at least one other control — a means of communication (e.g., awareness training).
Learn FAIR risk analysis with training approved by FAIR Institute.
Control analytics models that fail to account for these kinds of considerations will not produce accurate results. And this was a relatively simple example that just scratches the surface. Fortunately, the recently published FAIR Controls Analytics Model (FAIR-CAM) provides the means to support automated CRQ, and we should begin to see this leveraged in licensed products toward the end of 2022.
In the next post of this series, I’ll talk about the third dimension — data. What I have to say there is almost certain to raise some hackles…
Read the series by Jack Jones on automating cyber risk quantification.


-squared-1.png)
.png)


