 Jack Jones recently walked the FAIR Institute’s Data Integration Workgroup monthly call-in through a thinking exercise: Assume you’re the CISO of a mid-sized hospital – how do you understand the risk of ransomware?
As Jack spoke, he built out this mind map. Take a moment to grok the map, then read some explanatory notes from the Workgroup webinar below. (And above all, join the Workgroup to listen to the audio—it’s free and puts you in the invite list for future calls with Jack.)
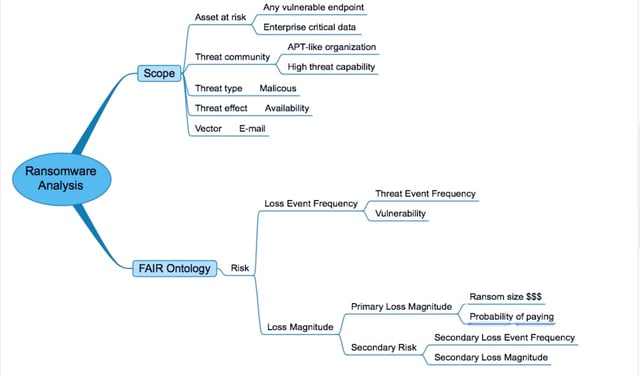
Jack reminded everyone that Measuring Cyber Risk Requires Two Models, Not One: FAIR, plus a model of the risk landscape being analyzed. The map shows the two branches related to the two models.
So we start the exercise at the top of the map with a look at the risk landscape.
NOTE: Keep in mind that this is meant to be a walkthrough of the analysis process, therefore the data/estimates were simply placeholders for discussion. Values used in a real analysis would be, in large part, specific to the organization performing the analysis.
Scope…
Jack assumes that our Threat Actors are not script kiddies making random probes of workstations but sophisticated criminals mounting a “targeted attack looking to essentially cripple an organization by finding the crown jewels, so to speak, that probably don’t reside on individual workstations in any significant volume.”
Jack calls it “enterprise class ransomware…in some respects a variation of APT” where the actors stealthily root around in systems unnoticed by the enterprise, searching for operationally critical data – the Asset at Risk.
FAIR Ontology…
Loss Event Frequency, Threat Event Frequency and Vulnerability
As a CISO of a mid-sized hospital, Jack says, we should have a good idea of how much malware we see annually, and one workgroup member chips in with a figure from the Verizon DBIR that 72% of malware attacks in healthcare were ransomware.
Jack suggests for the discussion that there’s a 30-60% chance of this hypothetical organization coming under this type of attack, based on last year’s data and we should expect an increase this year (Jack suggests subscribing to a threat intelligence service to keep up with trends).
He settles on an annual Threat Event Frequency range of twice a year to once every three years, commenting that Threat Event Frequency often gets over-estimated for lack of solid analysis.
On Vulnerability, Jack comments that hospitals tend to be less well funded and “generally not as mature” in cyber defense capabilities as some other industries. To help inform the vulnerability estimate, he suggests looking at patching metrics for a sense of how well the organization is keeping up defenses, and two other metrics: monitoring administrative privileges and SMB signing.
Jack concludes that, for this mid-sized hospital, “let’s say our Loss Event Frequency is essentially the same as our Threat Event Frequency. In other words, because of our less effective controls, anybody who’s really focused on getting us is going to get us.”
Loss Magnitude, Primary Loss Magnitude, Secondary Risk
Jack suggests two questions to ask on Primary Loss Magnitude:
“How much are we likely to have to pay?” Much of the data on that covers everyday ransomware, not the enterprise class, so the answer is still uncertain.
“What are the odds we are actually going to pay it?” Current data on how many victims do pay is too scattered to be entirely relied on, Jack thinks.
As a result, organizations need to understand their own strategy regarding payment. The question of paying or not paying will require two different analyses, since the impact implications are different.
Understanding the loss implications of not paying requires that you go to the data recovery people and ask some tough questions about recoverability, Jack says. Jack also suggests that internal subject matter experts (e.g., business operations) are typically well equipped to answer questions about operational losses – if our hospital’s emergency room must shut down, for instance.
Following that, have conversations with management to discuss recoverability, the potential ransom costs, and the costs for building more resilient defenses.
For Secondary Risk, Jack identified some factors, while saying the record isn’t that deep yet on fines and damages for enterprise class ransomware. “Like everything else in our industry, as lawyers see an opportunity to file lawsuits they going to find opportunities to claim damages from an outage as well, so can expect to begin to see more of that.”
What about the often-cited reputation damage? “We as an industry have tended to proclaim reputation damage as a huge outcome of these kinds of events, to some degree because we really haven’t had any better way of getting management’s attention. But the facts don’t necessarily support that.” (Read Jack's series of blog posts on reputation damage to look more closely at this issue.)
Jack suggests that “how an organization reacts to an event is really far more important” than the usual reputation considerations.” Risk analysis “should look at how data recovery and communication to public and stakeholders is set up—that’s really important.”
Wrapping up
The purpose of the walkthrough was to illustrate the process of performing this kind of analysis, and demonstrate the value of dialog and debate with other subject matter experts in arriving at more accurate results that can be explained and defended. It's useful to recognize that these kinds of analyses are generally easier when they're "real" rather than hypothetical.
But keep in mind that the goal is always to complete an analysis that gives management a clear picture of a range of outcomes in financial terms that enables decision making on how and where to invest in defenses–or pay or not pay a ransom–well before any screens turn red and freeze.
Related:
Pro Tip for FAIR Risk Scenario Analysis: Map It
How to Think About Likelihood, Probability and Frequency


