
In the first two posts of this series, we discussed the importance of building a threat library and risk rating tables followed by acquiring data to conduct analyses. In this final post, we will discuss analyzing the data and communicating it to management.
Analyze Forecast Accuracy
In this next part we will review the core process for analyzing the quality assessments of cyber-risk forecasting.
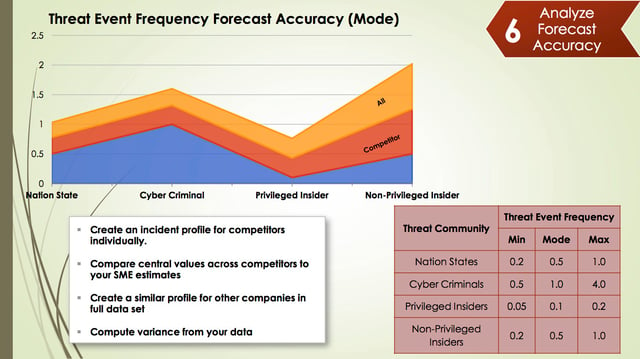
In this example, we will be using Threat Event Frequency (TEF) however know that this can also be done with the loss form values. One trick to making this work is to understand that the incidents you see in data breach reports are loss events, not threat events. As a result, you will have to work backwards through the FAIR model to go from Loss Event Frequency (LEF) to TEF. You will have to make some assumptions about what you think vulnerability (or control strength/threat capability) looks like for those organizations to do this.
Building the control strength assessments for your competitors can be challenging, however in general, it’s useful to use range estimates. For example, you can ask probing questions such as “Do I think that Goldman Sachs has better or worse controls than me? And by how much?” You might make an assumption that a smaller company in the dataset probably doesn't have the same ability to prevent attacks the same way that Scottrade does. But once you work through this, you can get a sense of how often attacks were attempted (TEF) based on what we know to be true about the number of losses they received (LEF).
Once the range estimates worked out, it’s pretty straightforward to understand what TEF looks like across the entire dataset by threat community but also what it looks like for our competitors. Organizations typically have a list of their competitors. Be careful, however as this list may be somewhat aspirational. For example, you might consider Wal-Mart one of your retail competitors, but given their scope and influence, attackers may not view you and them in the same way. You may need to adjust the list of competitors to ensure the numbers aren’t inflated. Once you have this kind of breakdown, its sets you up to have intelligent conversations with your management about what our competitors are experiencing compared to what you are experiencing. Those could be two very different things or very much the same. It's a great way to index the value of what you are doing in the industry.
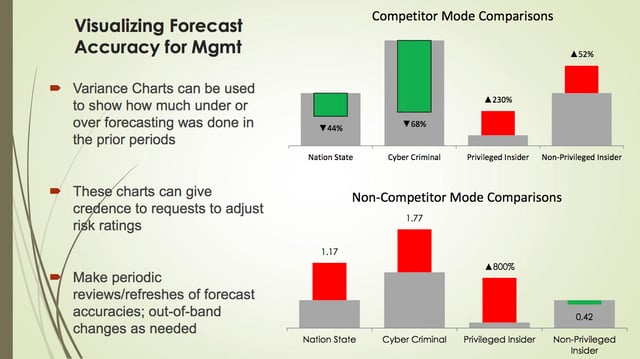
Creating some visuals can help management better understand what the risk landscape looks like and allows you to build a case for adjusting risk ratings. Most risk assessment tend to be “one and done” that are really fixed in time. It’s important that we assess the assumptions that were made when first completing the assessment against what the risk and threat landscape look like today. It’s important to consider incident data to help assess whether attack frequency has changed.
Consider what might happen if you didn't conduct this analysis and you approached an application manager about adjusting their risk ratings. Say they have a portfolio of 15 different applications some of which are high, medium, and low risk, and the risk assessment function comes to them, saying, “We need to change the risk rating for all these mediums to high.” They're certainly going to be surprised because it’s going to require additional controls and an effort from to manage it. Usually the risk assessment functions don't have a good story for why they're making changes such as this. That's really what this forecasting accuracy and risk assessment quality is helping to do: allow you to build a case for changing the forecast and then putting the changes in place slowly over time.
Change Management
In the above charts, you can see that the analysis indicates that we’ve been overestimating how often cybercriminals attack us, but we're underestimating the insider attacks, so we need to adjust these ratings. If you need to, you can go back and find the actual incidents from the data sources that you used to provide the narratives around why changes need to be made. It provides a powerful storytelling approach to adjusting risk ratings for groups that otherwise probably will never hear that.
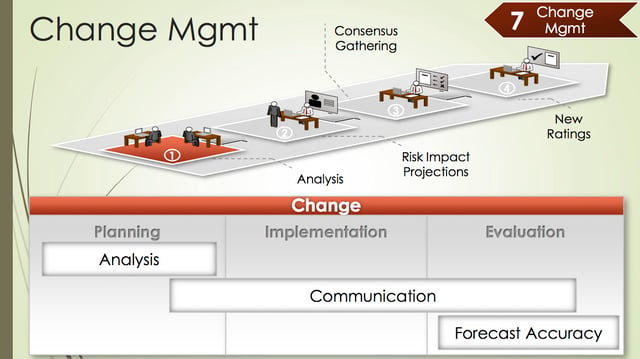
Having a good story is only part of it. There needs to be a controlled method for implementing these changes into the risk assessment environment and that’s where good change management practices come in. You have to invest in and communicate these types of analyses prior to taking action based on them. Slapping in risk assessment changes is going to make people upset. It takes time to make sure people understand why the changes are being made. You need to be thoughtful. If a quick change is necessary, don’t skip steps, but certainly accelerate the process. A good example of the need for a quick change in your risk rating tables would be if the legal system made sudden changes associated with how cyber risk liability is determined (such as allowing identity theft victims to begin claim emotional distress losses).
A good initial risk rating table cadence is about once every six months. This will also give you the opportunity to do some projections for the applications owners to show them what the changes will mean to them. It's also a good opportunity to include them in the decision making process and help them understand what their risk actually is.
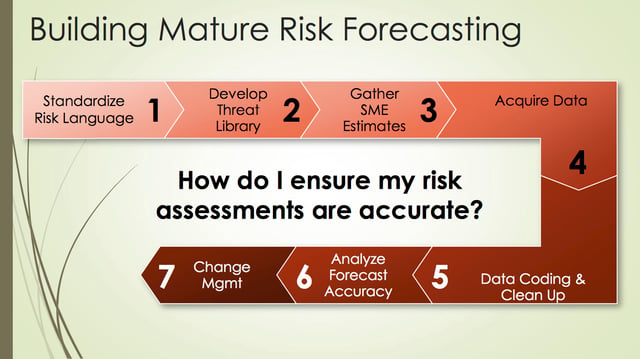
Then after implementing changes, you go back into the phase of gathering data and seeing how accurate it actually is. The whole process is cyclical and is how you maintain the quality of the risk evaluations you are doing.
I hope this series has been helpful in understanding how to assess the quality in your cyber-risk forecasting.


