 In my first post of this series, I focused on how to build a threat library and risk rating tables. In this post, I will explain how to leverage open source intelligence (OSINT) and internal data sources to build cyber risk forecasts.
Acquiring Data
Getting the data can be fun because there are a lot of really good sources out there:
- Verizon DBIR: I'm a huge fan. I think it has great benchmark data that companies can leverage.
- Privacy Rights Clearinghouse: Great tool because it’s helpful, free and open.
- Ponemon: A good source as long as you ignore the cost-per-record values. I don’t think those are very helpful when estimating risk.
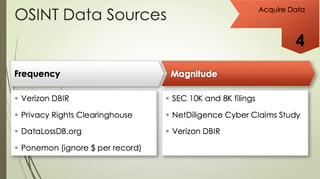
Some non-standard data sources that I like are the 10K and 8K filings of competitors. If their breach is large and material enough, it will be listed there. You get a good sense of the dollar values that are set aside to handle breaches. It’s always good to have those numbers on hand. For example, in Target’s 10K filing, they had assessed $41 million in losses and they claimed $17 million from their insurers.
Also on the loss side is the Net Diligence Cyber Claim study which the Verizon DBIR spent time working with. The Net Diligence report is really good because it talks about how much money people are actually claiming to their cyber insurer.
This next step is about leveraging internal data sources. There are some great process improvements that you can implement to integrate deeper into the threat management and incident response function. You will have to spend some time figuring out where your threat groups are in the incident response and threat intelligence cycles. As bad things are documented, you will be able to integrate that data into building your own datasets and characterize the threats that you are experiencing.
That's really what this is about: spending time figuring out when you have an incident.
- But how do we characterize it?
- What are the labels that we should use?
- How do we decide if they are obvious cyber criminals or nation states?
These questions bring us to the next point: the need to standardize the language that we use to categorize things.
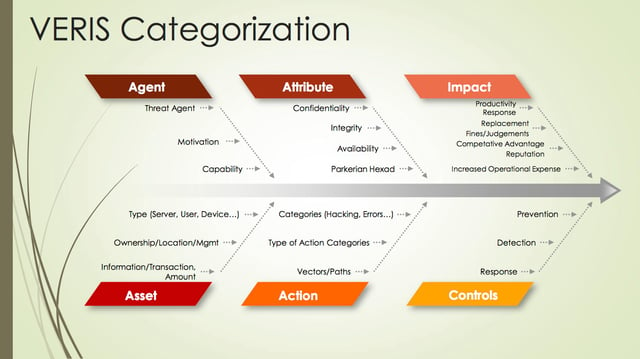
I am very fond of the Vocabulary for Event Recording and Incident Sharing (VERIS) taxonomy, especially because it integrates very well with FAIR. It allows us to describe the threats that we’re experiencing in a very useful way and utilize that data within a risk analytics model like FAIR.
Data Coding and Cleanup
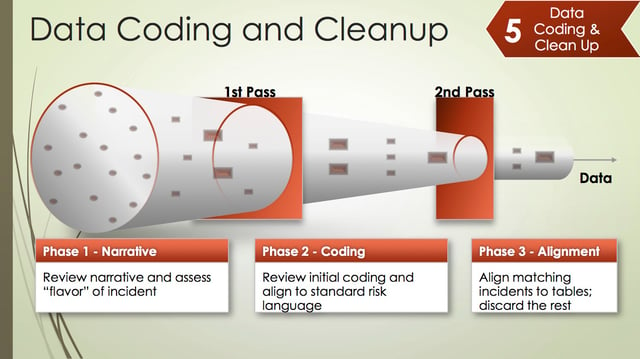
But even with all that data, whether internal or external, you still have to do some data coding and cleanup. That's one of the things that takes time, especially when dealing with external data. External data requires adaption to your own models for data coding.
One of the things that I recommend is to spend time reading the narratives of these data sets. A great example is the January 2015 Morgan Stanley hack entry in the Privacy Right Clearinghouse dataset. The narrative claimed that the account data of 650 people was stolen, but in the actual data record, there were zero accounts stolen. It was probably just a coding error, but it affects your analysis so spend some time reading the narrative.
The other thing to note is that some of the incident classification fields can be misleading. Let's say that you want to measure yourself against other financial services companies. Well, in that categorization (at least in the Privacy Rights Clearinghouse data set) that also includes health insurance and services companies such as Humana and Blue Cross Blue Shield. Depending on the specific business your company conducts, these kinds of breaches may or may not be relevant to you. You may need to filter out these specific incidents to tailor the data set to your organization.
In my next and final post of this series, I will discuss how to analyze the accuracy of the forecast.


