Drawing FAIR™ Conclusions from Cyentia’s Information Risk Insights Study (IRIS)

 The Cyentia Institute recently published the Information Risk Insights Study (IRIS), which utilized data gathered via Advisen on tens of thousands of known cyber events over the past decade to draw conclusions about the frequency and magnitude of such events.
If you’re a stats nerd and love a good scatter plot, this is the study for you. If you’re trying to understand more about how different factors such as your organization’s revenue and industry impact the frequency with which you can expect to fall victim to cyber events, this may also be the study for you.
For instance, Cyentia found that- “Over 60% of the Fortune 1000 had at least one public breach over the last decade. On an annual basis, we estimate one in four Fortune 1000 firms will suffer a cyber loss event.”
- “Government agencies, administrative and information services, and financial and management firms have the highest rates of data breach.”
For FAIR™ analysts…
This study may be a good way to supplement or bench mark the information you use internally to estimate the frequency and magnitude of the loss events in your organization.
But keep in mind that these values are general in that they are not asset, threat, or effect, specific and as such should not be used as “raw” inputs to your analyses without additional consideration and calibration.
Also, note that all events (C,I, or A) are dubbed as a “breach” for the purposes of this study, as opposed to a FAIR scenario-based approach.
Caveats aside, the Institute was successful in using data to strengthen two points that the FAIR community has been advocating for a long time on measuring and reporting on risk:
Measurement: Putting a Stake through the Heart of the Per-Record Rate
In an effort to make cyber risk management as simple as possible, many organizations take to adopting a per-record rate that can be used to calculate the economic loss to the organization if a data breach occurs.
The most well-known of these is Ponemon, which proposes a per-record rate of $150. Based on the IRIS, predicted losses using the Ponemon model routinely exceed actual losses by $10M and on the other side of the perspective, can understate losses by as much as $100B for a single loss event. “A single cost-per-record metric simply doesn’t work and shouldn’t be used,” the IRIS report says.
from the Cyentia IRIS report:
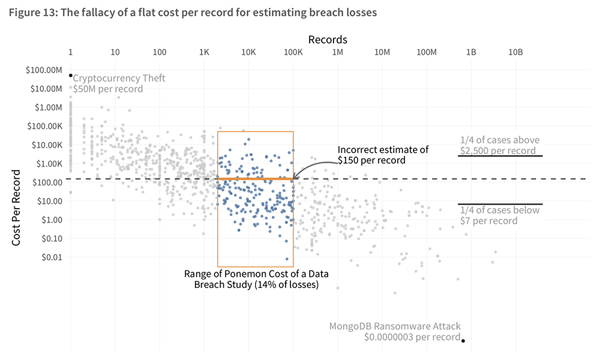
I agree. As one of my favorite quotes says, things should be as simple as possible, but no simpler. In the case of estimating loss exposure, using a per record rate is making things too simple and by doing so, fundamentally wrong.
Using FAIR, instead of using a per record estimate for loss exposure, we use accurate and usefully precise ranges to provide estimates related to six different ways in which loss typically materializes in a cyber event (see this blog post: A Crash Course on Capturing Loss Magnitude with the FAIR Model).
Reporting: Support for Loss Exceedance Curves
In the search for the “typical” event, the default metric used in reporting the loss exposure (annualized or otherwise) is often the average or mathematical mean. While this sounds good in theory, the IRIS points out the one thing you’re forgetting in doing so – your distribution is not normal. In heavy-tailed distributions, which result from a relatively low likelihood of a particularly severe outcome occurring, there is nothing average about the event the mean is reporting on.
The study goes on to recommend the use of loss exceedance curves which combine the frequency of loss events with their loss magnitude on a curve to show the probability that losses with exceed a certain threshold.
Sound familiar? Using the FAIR model, instead of FUD-mongering using overinflated results (intentional or not), we utilize this very concept to report on the range of probable outcomes, including the 10th and 90th percentiles, as well as the absolute minimum and maximum.
Additionally, in order to offset the potentially over (or under) inflated mean, we report on the Most Likely value as well. This gives the full picture to decision makers and enables a well-informed decision. (See this blog post on loss exceedance curves and FAIR analysis.)
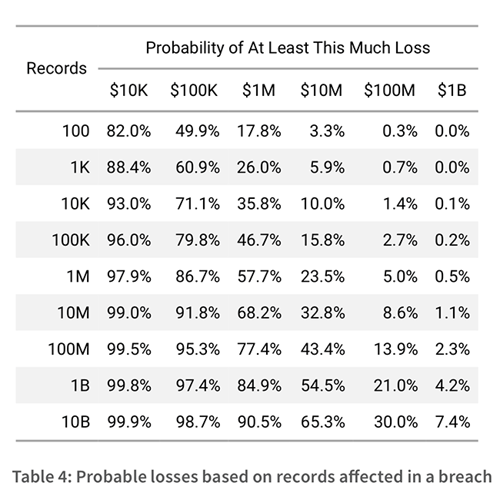
Cyentia goes on to say that instead of using a per record count, you can look at a range of losses possible based on record count, similar to the use of loss tables in FAIR analysis. The report includes the general purpose table below. Sophisticated FAIR analysts build their own loss tables specific to their organizations, for instance, using the loss-table functionality on the RiskLens platform, which also runs on Advisen data and other sources.
 Note: Wader Baker, PhD, Partner and Co-Founder of Cyentia Institute, is a member of the FAIR Institute Board of Advisors and a long-time friend of FAIR.


