 Wade Baker set an ambitious goal for this 30-minute talk from the recent FAIRCON2020: Direct the audience to a public data source for each of the factors in the FAIR™ model.
As the founding leader of the Verizon Data Breach Investigation Report (DBIR), the widely used source of cybersecurity statistics, and now a founder of the research firm Cyentia Institute (and a FAIR Institute Advisory Board Member), Wade has been a pioneer in the quest for better data. His talk draws on research done by Cyentia.
Watch Wade’s FAIR Conference session, “How Better Data Can Help Make Better Decisions”. Join the FAIR Institute Now (it’s free to qualified professionals) .
You’ll want to watch the video to get the full value, but here’s a cheat sheet running through the FAIR factors – see the FAIR model here.
FREQUENCY SIDE OF THE FAIR MODEL:
Loss Event Frequency
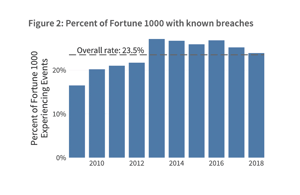 Cyentia’s IRIS Report looked at known breaches among Fortune 1000 firms and came up with a range of incidents, depending on company size. Overall, about one-quarter of those firms have a breach in a given year.
Threat Event Frequency
Wade suggested searching the Cyentia Library, with links to articles covering 2,500 security industry topics. A search for “DDOS attack”, for instance, pulls up a large number of surveys and trend reports from various sources.
 Contact Frequency
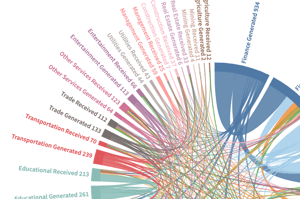
The question here is how often threat actors come in contact with your organization, and Wade offered a Cyentia report on Ripples Across the Risk Surface that looks at the (increasing) frequency of loss event “ripples”, in other words, a loss event at a business partner that affects your business.
Probability of Action
This factor covers the probability of a threat actor exploiting a vulnerability – and Cyentia helped develop the Exploit Prediction Scoring System Calculator with Kenna Security, an open framework for scoring the probability of exploit in the next 12 months of a specified vulnerability.
Vulnerability
“Vulnerability in software is very, very widespread and very, very hard to get rid of,” Wade said. He showed the Veracode State of Software Security report on the (tiny) percentage of vulnerability findings that get closed.
Resistance Strength
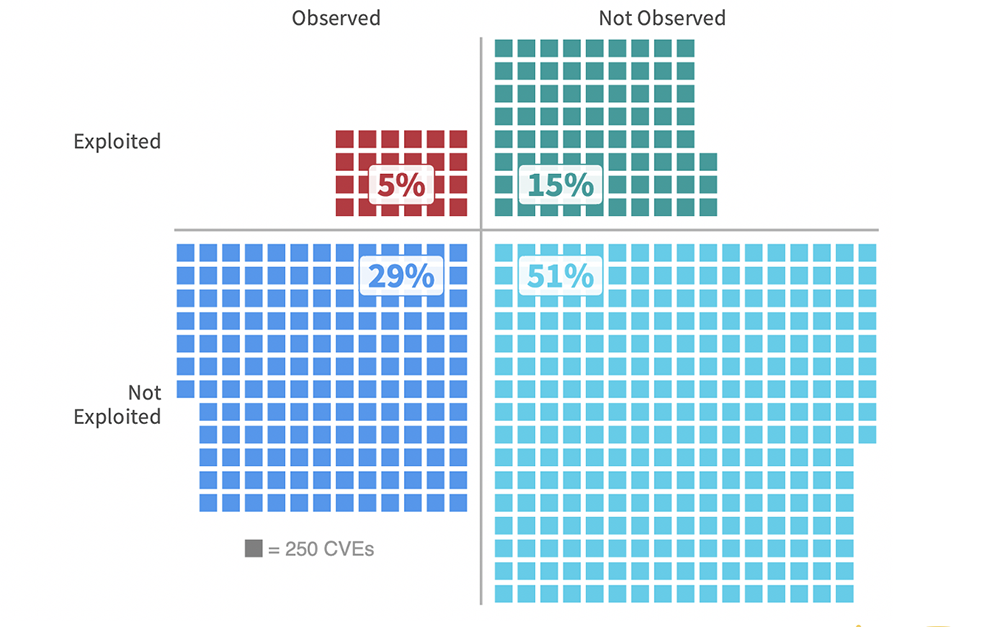
The Prioritization to Prediction Report shows that consistently the ratio of open to closed vulnerabilities is about one in 10 no matter how large the organization, a clue, Wade said, that your resistance strength may be less than you think. Thirty-three percent of organizations are falling behind on remediation, the report found.
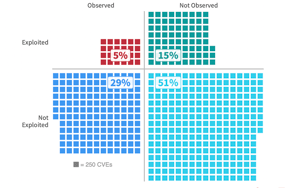
Threat Capability
How capable are adversaries to compromise your systems? The Prioritization to Prediction Report also shows that there’s a sweet spot of only 5% of all published vulnerabilities that have both been observed in the wild and have known exploits.
MAGNITUDE SIDE OF THE FAIR MODEL:
Primary Loss Magnitude
Wade offers a lot of good and very specific data here from the IRIS Report – but it boils down to this: “Next time you’re asked what a breach will cost, ‘A couple hundred thousand dollars is a simple answer backed by a lot of data. But there’s a 10% chance it could be 100x higher or more’.” The report also offers a handy probability chart for cost of a breach depending on number of records.
Secondary Loss Event Frequency
A recent update to the IRIS Report did a deep dive on the largest cyber losses over last five years, paying attention to the six forms of loss in FAIR and found, for instance, a median $21 million for fines and judgements, a key component of Secondary Loss Event Frequency, and no quantifiable losses for reputation damage.
Watch the FAIRCON2020 video “How Better Data Can Help Make Better Decisions” on LINK (FAIR Institute membership required).
Learn more in these blog posts:
Drawing FAIR™ Conclusions from Cyentia’s Information Risk Insights Study (IRIS)
Jack Jones: No Data? No Problem