Every year the masses of information security professionals gather at the Moscone Center in San Francisco for the RSA Conference looking for opportunities to learn from peers and discuss their latest challenges, and this year was no different. I had the privilege to share my own perspective as a speaker in the GRC track. As I prepared for the session, I often asked myself what I could add to the volume of guidance on risk management already available. Sure, there are numerous models, methodologies, frameworks, and opinions on how to manage information risk, but many organizations still struggle to get their program off the ground or demonstrate its value. In the spirit of keeping it simple, I shared an approach to overhauling an information risk program without getting overwhelmed. Here are some highlights...
You can view a video of the session on the RSA Conference 2017 site, and the session slides are available for download in the Downloads & Media section.
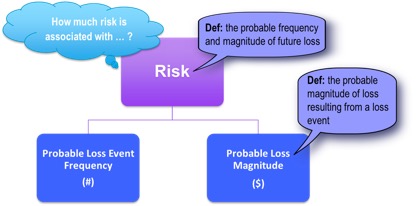
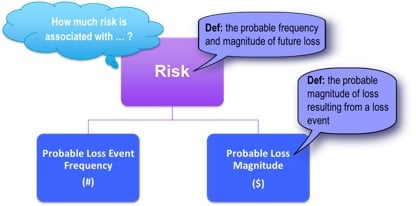
Start with a simple question, “What are the top risks for the organization?” A simple question on the surface, but where do you start to gather this information? Using the Factor Analysis of Information Risk (FAIR) as the foundation of your framework, you realize that you must define what a risk is and how you will measure it. Don’t underestimate the value of standardizing terminology. We’re keeping it simple, so we’ll just go down one level in the FAIR ontology:
The next tip is to forget what you think you know about qualitative and quantitative measurements of risk. No matter how much you want to multiple red times orange, you can’t. So stop trying.

Quantitative measurements aren’t beyond your reach. You just need to take an iterative approach. You’ll be tempted to think that your organization is a unique snowflake, and that what works for those other risk disciplines couldn’t possibly apply in the world of quickly changing technology and adversarial actors. In the wise words of Douglass Hubbard:
- Your problem is not as unique as you think.
- You have more data than you think.
- You need less data than you think.
- There is a useful measurement that is much simpler than you think.
(Doug’s latest book How to Measure Anything in Cybersecurity Risk is a must read)
Likewise, don’t think of qualitative evaluations as all rubbish; you just need to understand their limitations and how to use them along the evolution of your program.
Still keeping our “top risks” question in mind, embrace two concepts and suddenly this exercise will seem a lot less daunting:
- Precision isn’t the goal, accuracy is. Start expressing all your estimations of potential frequency and magnitude as ranges of values.
- State an explicit time horizon. Any useful estimation needs to be bound by time, the most common timeframe is annual.
So how do you dip your toe into the quantitative pool? Use FAIR’s forms of loss to build and organize initial ranges of impact. Although you eventually want to have dollar ranges that can be normalized and aggregated, don’t start there. Put yourself in the shoes of your business partners and SMEs, how do they think about impact in their day to day work? Take replacement cost for example, does your organization set limits on signing authority by seniority? Your CEO may be able to approve up to a certain limit, and then he/she needs Board approval beyond that. This is an implicit risk exposure range.
Similarly, the potential revenue loss may be directly tied to the duration of a service outage. This business line talks the language of Recovery Time Objective (RTO). So start by scaling your ranges using RTO as the base. The first iteration of your impact table might look something like this:
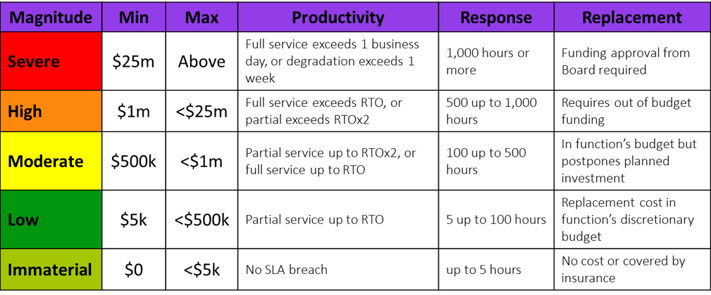
Notice that Productivity, Response, and Replacement are all discrete and measurable ranges which are associated with a dollar range, and translated into the familiar qualitative label of High, Moderate, etc. Think of this as a bridge between the scales the business is used to seeing but improves on the subjective definitions that plague so many models (e.g. minimal impact, limited impact, devastating impact, etc.). Your SMEs don’t even need to see the dollar ranges, they just have to estimate familiar concepts of RTO, staff hours, budget limits, etc.
Although many programs don’t bother to differentiate, there is a difference between Likelihood and Frequency. Using a pure likelihood approach immediately skews your model towards the rare event with a single occurrence (e.g. California will only fall into the ocean once). Keeping to the highest level of the FAIR ontology, it’s best to think in terms of frequency. You could use predefined ranges like these:

Finally, include a Confidence rating for every analysis and make it transparent in your reporting to senior management. Quite simply, your analyses will improve over time and decision makers need to take this into account. The confidence rating can be as simple as this maturity scale:
Initial / Intuitive - Immature or developing assessment approach exists, a formal assessment model may not be established or is in early stages. Relevant controls haven’t been tested, or coverage has significant gaps. Conclusions are largely based on the experience of the assessors and intended control design.
Repeatable - An assessment model is established and is producing consistent assessments using standard criteria. Risks are being regularly assessed. Assessment may be based on consensus opinion, or assessors are at least sampling controls for testing, engaging risk-practiced SME's, reviewing incident statistics, or referencing trend data to inform assessments. Testing or assessment coverage may be limited, but visibility is thought to be representative.
Measurable - Assessment model is well defined and has been refined/calibrated over time, and trend data and incident statistics have been analyzed to model future estimates. A significant control population has been tested. Assessors are trained, practiced, and experienced analyzing risks in this area. The assessments themselves may have been revised and updated over time.
In summary, your 1.0 version rollout of FAIR would include these elements:
- Predefined Ranges (min, max)
- Annualized Timeframe
- Best, Most Likely or Worst Case
- 5 Categories of Primary Loss
- Primary Loss Event Frequency
- Confidence (qualitative)
- Residual Risk (ordinal scale)
Once you master these concepts and embed them into how your organization makes decisions, you’ll be ready to explore more advanced implementations of FAIR. Take it slow and give your organization time to absorb the many changes you’re introducing. Using these techniques, you should be able to not only articulate your organization’s top risks, but also defend the list when challenged.
If you found this topic intriguing, then you’ll definitely want to attend the InfoSec World 2017 Risk Management Summit in April. This a rare opportunity to spend a day learning from the mastermind behind FAIR, Jack Jones, in a small and interactive setting. The Summit promises to challenge conventional information risk management approaches and offer pragmatic alternatives.