


 "Expert judgment has always played a large role in science and engineering. Increasingly, expert judgment is recognized as just another type of scientific data …" -Goossens et al., “Application and Evaluation of an Expert Judgment Elicitation Procedure for Correlations”
Have you ever thought to yourself, if only there were an easy way of aggregating the numerical estimates of experts to use in a risk analysis... then this post is for you. My previous post on this topic, Aggregating Expert Opinion in Risk Analysis: An Overview of Methods covered the basics of expert opinion and the two main methods of aggregation, behavioral and mathematical. While each method has pros and cons, the resulting single distribution is a representation of all the estimates provided by the group and can be used in a risk analysis. This post focuses on one, of several, mathematical methods - simple averaging in Excel.
 Author Tony Martin-Vegue is a co-chair of the San Francisco Bay Area Chapter of the FAIR Institute and is a veteran FAIR analyst.
This article originally appeared on Tony's blog.
But first, a note about averaging…
Have you heard the joke about the statistician who drowned in 3 feet of water, on average? An average is one number that represents the central tendency of a set of numbers. Averaging is a way to communicate data efficiently, and because it's broadly understood, many are comfortable with using it. However – the major flaw with averaging a group of numbers is that insight into extreme values is lost. This concept is expertly covered in Dr. Sam Savage’s book, The Flaw of Averages.
Consider this example. The table below represents two (fictional) companies’ year-over-year ransomware incident data.
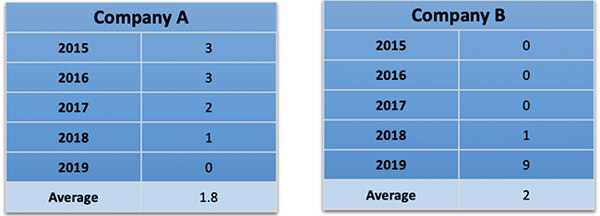
Fig 1: Company A and Company B ransomware incident data. On average, it’s about the same. Examining the values separately reveals a different story
After analyzing the data, one could make the following assertion:
Over a 5-year period, the ransomware incident rates for Company A and Company B, on average, are about the same.
This is a true statement.
One could also make a different – and also true – assertion.
Company A’s ransomware infection rates are slowly reducing, year over year. Something very, very bad happened to Company B in 2019.
In the first assertion, the 2019 infection rate for Company B is an extreme value that gets lost in averaging. The story changes when the data is analyzed as a set instead of a single value. The cautionary tale of averaging expert opinion into a single distribution is this: the analyst loses insight into those extreme values.
Those extreme values may represent:
- An expert misinterpreted data or has different assumptions that skew the distribution and introduces error into the analysis.
- The person that gave the extreme value knows something that no one else knows and is right. Averaging loses this insight.
- The “expert” is not an expert after all, and the estimations are little more than made up. This may not even be intentional – the individual may truly believe they have expertise in the area (see the Dunning-Kruger effect). Averaging rolls this into one skewed number.
Whenever one takes a group of distributions and combines them into one single distribution – regardless of whether you are using simple arithmetic mean or linear opinion pooling with weighting, you are going to lose something. Some methods minimize errors in one area, at the expense of others. Be aware of this problem. Overall, the advantages of using group estimates outweigh the drawbacks. My best advice is to be aware of the flaws of averages and always review and investigate extreme values in data sets.
Let’s get to it
To help us conceptualize the method, imagine this scenario:
You are a risk manager at a Fortune 100 company, and you want to update the company's risk analysis on a significant data breach of 100,000 or more records containing PII. You have last years’ estimate and have performed analysis on breach probabilities using public datasets. The company's controls have improved in the previous year, and, according to maturity model benchmarking, controls are above the industry average.
The first step is to analyze the data and fit it to the analysis – as it applies to the company and, more importantly, the question under consideration. It’s clear that while all the data points are helpful, no single data point fits the analysis exactly. Some level of adjustment is needed to forecast future data breaches given the changing control environment. This is where experts come in. They take all the available data, analyze it, and use it to create a forecast.
The next step is to gather some people in the Information Security department together and ask for a review and update of the company's analysis of a significant data breach using the following data:
- Last year's analysis, which put the probability of a significant data breach at between 5% and 15%
- Your analysis of data breaches using public data sets, which puts the probability at between 5% and 10%.
- Status of projects that influence - in either direction - the probability or the impact of such an event.
- Other relevant information, such as a year-over-year comparison of penetration test results, vulnerability scans, mean-time-to-remediation metrics, staffing levels and audit results.
Armed with this data, the experts provide three estimates. In FAIR terminology, this is articulated as - with a 90% confidence interval- “Minimum value” (5%), Most Likely (50%), and Maximum (95%). In other words, you are asking your experts to provide a range that, they believe, will include the true value 90% of the time.
The experts return the following:
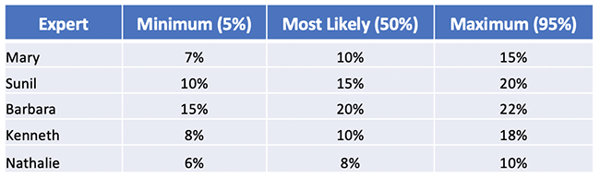
Fig 2: Data breach probability estimates from company experts
There are differences, but generally, the experts are in the same ballpark. Nothing jumps out at us as an extreme value that might need follow-up with an expert to check assumptions, review the data or see if they know something the rest of the group doesn't know (e.g. a critical control failure).
How do we combine them?
Aggregating estimates employs a few major performance improvements to the inputs to our risk analysis. First, it pools the collective wisdom of our experts. We have a better chance of arriving at an accurate answer than just using the opinion of one expert. Second, as described in The Wisdom of Crowds, by James Surowiecki opinion aggregation tents to cancel out bias. For example, the overconfident folks will cancel out the under-confident ones, etc. Last - we are able to use a true forecast in the risk analysis that represents a changing control environment. Using solely historical data doesn’t reflect the changing control environment and the changing threat landscape.
For this example., we are going to use Microsoft Excel, but any semi-modern spreadsheet program will work. There are three ways to measure the central tendency of a group of numbers: mean, mode, and median. Mode counts the number of occurrences of numbers in a data set, so it is not the best choice. Mean and median are most appropriate for this application. There is not a clear consensus around which one of the two, mean or median, performs better. However, recent research jointly performed by USC and the Department of Homeland Security examining median versus mean when averaging expert judgement estimates indicates the following:
- Mean averaging corrects for over-confidence better than median, therefore it performs well when experts are not calibrated. However, mean averaging is influenced by extreme values
- Median performs better when experts are calibrated and independent. Median is not influenced by extreme values.
I’m going to demonstrate both. Here are the results of performing both function on the data in Fig. 1:\
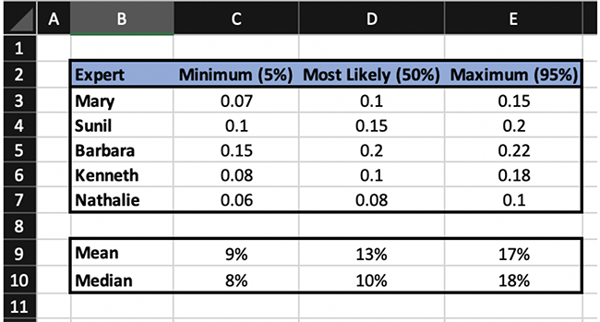
Fig 3. Mean and Median values of the data found in Fig. 2
The mean function in Excel is =AVERAGE(number1, number2…)
The median function in Excel is=MEDIAN(number1, number2…)
Download the Excel workbook here to see the results.
Next Steps
The results are easily used in a risk analysis. The probability of a data breach is based on external research, internal data, takes in-flight security projects into account and brings in the opinion of our own experts. In other words, it’s defensible. FAIR users can simply replace the probability percentages with frequency numbers and perform the same math functions.
Further Reading
The Flaw of Averages by Sam Savage
Naked Statistics by Charles Weelan | Easy-to-read primer of some of these concepts
Median Aggregation of Distribution Functions | paper by Stephen C. Hora, Benjamin R. Fransen, Natasha Hawkins and Irving Susel
Is It Better to Average Probabilities or Quantiles? | paper by Kenneth C. Lichtendahl, Jr., Yael Grushka-Cockayne and Robert L. Winkler
Application and Evaluation of an Expert Judgment Elicitation Procedure for Correlations | paper by Mariëlle Zondervan-Zwijnenburg, Wenneke van de Schoot-Hubeek, Kimberley Lek, Herbert Hoijtink, and Rens van de Schoot
Join us for the 2019 FAIR Conference, bringing leaders in information and operational risk management together to explore best FAIR practices that produce greater value and alignment with business goals. Gaylord National Resort & Convention Center, National Harbor, MD, September 24 & 25, 2019. More information on FAIRCON19.

-squared-1.png)
.png)


