
 Adding the “So What?”
It’s easy to understand that higher levels of maturity in various controls or risk management functions should equate to less risk. The challenge comes in measuring how much risk will be reduced by certain improvements. This is a crucial capability if we want to cost-effectively prioritize our efforts and/or demonstrate the value of our risk mitigation efforts to get additional support from key stakeholders. In this final post in the series, I’ll provide a high-level example of measuring risk reduction "in action."
Data Destruction
The NIST CSF subcategory PR.IP-6 instructs an organization to rate itself as to whether “data is destroyed according to policy.” Using the NIST CSF maturity scale, let’s assume that our hypothetical organization rated itself as Tier 2: Risk Informed. As I mentioned in Part 2 of this series, the tiers within NIST CSF aren't intended to be used for measuring the condition of sub-categories. That being the case, let's assume that the organization has defined their own scale or has subjectively decided that on a 1-to-4 scale they feel the organization is more “2” than 1 or 3. Now, the question to be answered is, “What’s to be gained from maturing to 3 or even 4 on the scale?”
Commonly, when measuring the value proposition for better security, you start by measuring the organization's current state risk as it relates to the controls in question, in this case the data destruction controls. This requires defining the relevant loss event scenarios, for example:
- Sensitive data is accidentally disclosed to unauthorized persons when disk drives are taken out of service and inappropriately disposed of.
Each relevant loss scenario is then evaluated using FAIR to arrive at an annualized loss exposure given the current state of data destruction controls. In this example, we have highlighted just one loss event scenario, although you could certainly include others, like failure to shred sensitive paper documents. For illustration’s sake, let’s assume the current state analysis arrives at the following results:
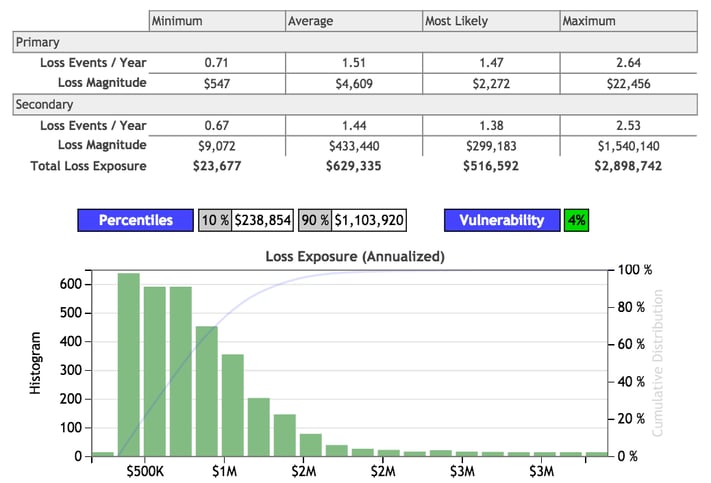
These results reflect the organization’s “2” level of data destruction maturity; i.e., the processes surrounding data destruction aren’t reliable.
To perform the next step in the analysis, the organization has to figure out which improvements would take it to a “3” and a “4” level of maturity. Perhaps reaching a maturity level of 3 is simply believed to involve periodic testing of drives being disposed of. Level 4 maturity (the top of the scale) might be defined as also implementing a second review and sign-off of each drive before it leaves the premises.
To continue our example, let’s say that moving to level 3 has the following effect on risk:
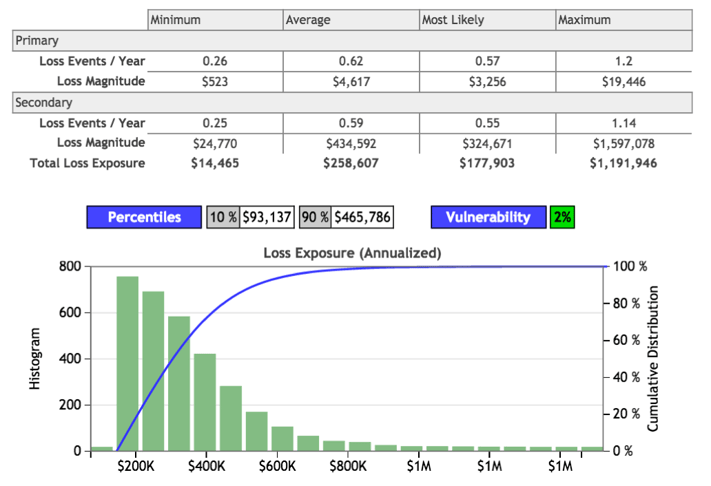
Further analysis suggests that maturing to level 4 has the following effect on risk:
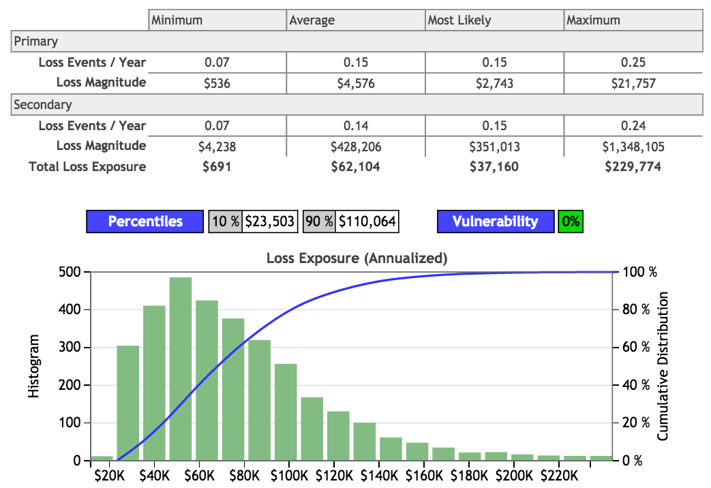
A comparison of these analyses shows the following loss exposure characteristics for Level 2 (current state) vs. Level 3 vs. Level 4:
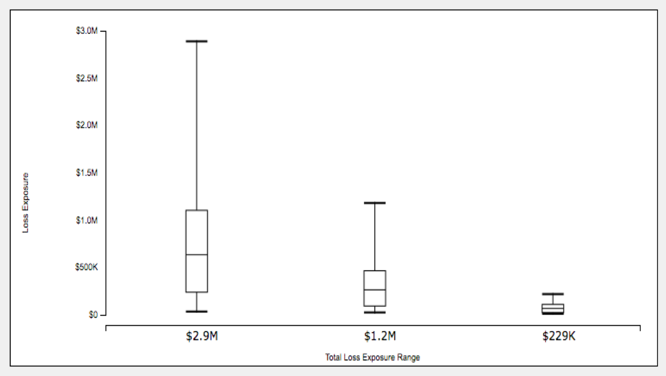
For those readers who aren’t familiar with box and whisker charts:
- The top horizontal line in each column represents the maximum value.
- The top of each box represents the 90th percentile.
- The middle line within each box represents the average.
- The bottom of each box represents the 10th percentile.
- The bottom horizontal line represents the minimum.
Given the results of this analysis, the organization is in a much better position to decide whether the costs associated with maturing to various levels are appropriately offset by the reduction in risk. In addition, the organization would be able to make risk-based decisions about which subcategories to focus on first, if it performed a series analyses against proposed improvements to other NIST CSF subcategories.
Additional Observations
The good news first. The example above should clearly demonstrate the value proposition for leveraging FAIR in combination with NIST CSF. Now to the bad news. In order to keep this post shorter and easier to understand, I cherry-picked an easy subcategory for demonstration. If I had tried to demonstrate measuring the risk reduction benefit of a subcategory like ID.AM-4 (external information systems are cataloged), it would have been more difficult because that subcategory is a risk management control (specifically, a risk landscape visibility factor) rather than a loss event control. It can still be done of course, but it involves more work. If there is sufficient interest, I can in a later post include an example of how that would be done.
The bottom line is that the NIST CSF provides a decent list of controls and capabilities that organizations can evaluate themselves (or other organizations) with. When combined with an analytic method like FAIR, the value proposition of proposed improvements becomes much clearer: organizations are able to prioritize more effectively and gain stakeholder support more easily.
In the next (and final) post of this series, I'll share an approach to scoring the NIST CSF sub-categories that I've found to be useful.
If you missed my previous posts on NIST CSF & FAIR, please read parts one, two, and three.


