


 Let’s talk DREAD (threat modeling, not the overwhelming feeling of despair associated with your reoccurring 4:30 p.m. Friday meeting). So, what is the DREAD threat model?
If you caught the use of the word “threat” rather than “risk” then good, it was intentional. If you google “DREAD Framework,” it is referenced as a “qualitative risk assessment model.” The word "risk" is a little misleading in this context.
2 Definitions of Cyber Risk:
>>In DREAD terms, risk references the potential threat associated with something, in very general terms: How bad is this thing as compared to other things?
>>In FAIR™ (Factor Analysis of Information Risk) terms, risk references the probable frequency and probable magnitude of a future loss event. Keep this distinction in mind as you read on.
![]() Learn cyber risk quantification through the FAIR Institute.
Learn cyber risk quantification through the FAIR Institute.
See our FAIR training opportunities in 2023.
DREAD is a framework that can be used to evaluate and triage various threats by rating them on an ordinal scale.
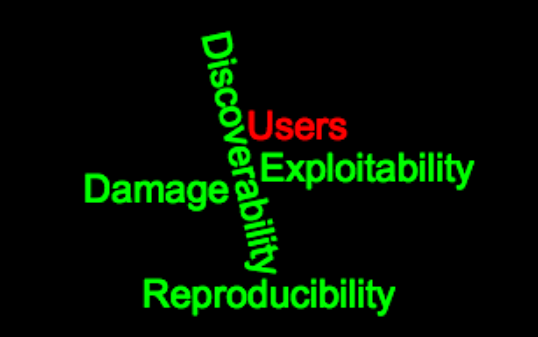
The framework is broken into five main categories: Damage, Reproducibility, Exploitability, Affected Users, and Discoverability. Below I will outline the five categories and how they can (or in some instances – can’t) be used in conjunction with the FAIR model.
Framework vs Model in Cyber Risk – What’s the Difference?
We’re using “model“ here because that’s how DREAD is most often described. More properly, it’s a framework. FAIR creator Jack Jones explains the difference: ‘A model is a simplified representation of a more complex reality. It should support analysis by describing how things are related. Common security frameworks are not analytic models because they don’t define relationships, they categorize.”
5 Categories of DREAD Threat Classification
1. Damage – how bad would an attack be?
As you can probably guess, Damage is referring to the extent to which the asset(s) in question are affected by the threat. In the FAIR model, when we think about how bad an event will be, we are considering Loss Magnitude. The biggest difference between Loss Magnitude and Damage is that Damage is asking the question “how bad?” and FAIR is asking the question “how much?” That slight change of wording is actually far more significant than you think. “How bad?” asks what could happen from an event perspective. “How much?” asks what dollar amount of loss we can expect to see as a result of this occurring.
Given that Damage allows you to think through the potential outcomes – will confidential data be lost? Will additional vulnerabilities be identified? Will an application be taken offline? It can be useful in helping to better scope and understand your FAIR risk assessment but might not be particularly useful in the Loss Magnitude side of the model as you might initially expect. As alluded to above, this scoring mechanism can be useful in helping to quickly triage different scenarios you are considering quantifying with the RiskLens Cyber Risk Quantification (CRQ) or other FAIR-based tool. For example, it may be a better use of your time to quantify a risk scenario with an 8-10 Damage rating versus a 0-2.
Read: A Crash Course on Loss Magnitude with FAIR
2. Reproducibility – how easy is it to reproduce this attack?
The concept of Reproducibility is primarily focused on how often the stated event can potentially occur. The best way to think of this is, how pervasive is this threat? Is it being applied repetitively across your industry or even your organization specifically?
In the FAIR model, Reproducibility is most closely related to Threat Event Frequency. The easier it is to reproduce the action, the easier it is to attempt an attack. That being said, however, the specific rating of reproducibility is not easily applied within the FAIR model. Threat Event Frequency is a numeric value stating how many times in a given time period we expect the event to occur, therefore a score is not relevant to determining it.
There is good news, however. Whoever you spoke with to help to determine the overall Reproducibility of the threat for your DREAD analysis can likely give you some insight into the Threat Event Frequency for your FAIR Model – now go find her!
3. Exploitability – how much work is it to launch this attack?
Exploitability is likely exactly what you are thinking it is: How vulnerable are we to this attack? As such, Exploitability relates directly to the FAIR component of Vulnerability (or Susceptibility). Vulnerability is made up of two components: Resistance Strength and Threat Capability, both of which Exploitability takes into consideration.
When rating Exploitability, you are essentially considering how hard it is to complete this action. Are there tools necessary, or just internet access? Is the tool or malware/vector easily available online? Do you need Edward Employee to click on a phishy link (I couldn’t resist), or can you do it yourself? Based on these questions, you rate the Exploitability between 0-10.
Similarly, in FAIR, we consider all those questions and then use calibration and organizational/industry data to assign a percentage to Vulnerability, i.e., as an organization you may be between 45% - 80% vulnerable to the particular scenario.
While you cannot simply plug your DREAD rating into the FAIR model, you can use it as a guide for determining the percentage you assign to Vulnerability. For example, a DREAD Exploitability rating of 8-10 may correlate to a FAIR Vulnerability of 80% - 100%, or whatever scale your organization finds to be the most appropriate.
As illustrated above, Exploitability can be directly translated into the FAIR model and as such, is arguably the most important DREAD aspect to exploit in your FAIR analysis (Yes, I went there.)
Join the FAIR quantification movement - join the FAIR Institute as a Contributing Member for full access to educational materials, events and networking opportunities.
4. Affected Users – how many people will be impacted?
The fourth category of DREAD, Affected Users, does not correlate as easily to the FAIR model. There are a couple of reasons for this. The first being that in the DREAD framework, Affected Users is meant to identify the extent of the damage of the event – i.e. how many people does this event “touch”.
While there is not a specific node of the FAIR model that is dedicated solely to the concept of Affected Users, it is taken into consideration in several of the forms of loss that make up the Loss Magnitude side of the model.
Think availability loss. Your key system has suffered a DDoS attack and now a number of your employees are unable to perform their responsibilities as they were directly tied to that key system. In the FAIR world, that sounds like Productivity Loss. That being said, though, there are generally workarounds in place – are your employees sitting there twiddling their thumbs for three hours while you get your system back online? (If so, then you better be careful of insider threats that just might take your system down to get some R&R.)
In all seriousness though, I am guessing probably not. One way or another, the show must go on and more than likely the amount of potential loss (the un-utilized time multiplied by the loaded hourly rate) is not particularly significant. So yes, you can map it here, but it will not have an overwhelming impact.
The second reason is short and sweet: the ranges in place for the Affected Users category in DREAD are too generic to be usable in a FAIR analysis. Remember, we like accurate with a useful degree of precision. Going from a “group of users” to “all users” is hardly a useful degree of precision if the “group” is my high school friends (all three of us) and “all users” is the population of planet earth. That being said, the scales for affected users in DREAD are far too broad and undefined, and as such do not allow for accuracy or consistency, both of which are key components to the FAIR model.
5. Discoverability – how easy is it to discover the threat?
As opposed to “how easy is it to discover the threat?” the question here might more aptly be “how easy is it to discover the Vulnerability?” As you probably guessed from my incredibly subtle text emphasis there, Discoverability also relates to Vulnerability. Yes, if Vulnerability is a Steve Martin comedy, then Reproducibility, Exploitability, and Discoverability are the Three Amigos (this is why I have three friends). The general thought process there being if the weakness is easily Discoverable, and easily Exploitable/ Reproduceable then it is a Vulnerability.
Watch: Vulnerability in Risk Analysis, Explained in 2 Minutes [Video]
As illustrated in the discussion above, the DREAD Threat Assessment Framework does have its parallels to the FAIR model. Specifically, it ties primarily to the left side of the model: Loss Event Frequency. If you think about it, this makes perfect sense. It is a Threat Assessment Framework, not a Risk Assessment Framework. In the FAIR model, Risk is defined as the probable frequency and probable magnitude of future loss. The Dread Framework allows you to consider the concepts underlying the frequency side of that equation, and in some cases like Exploitability, even to begin to quantify them.
It is important to keep in mind, however, that the ordinal scales you are using to assess threats within the DREAD model are not the same as the quantitative values you will utilize and calculate when using the FAIR model. DREAD is a qualitative model, not a quantitative model, but it is useful for determining the quantitative values to utilize in your FAIR analysis.
Next Steps toward Risk Analysis after DREAD Threat Modeling – Moving to Risk Quantification with FAIR
As we’ve seen that by triaging risks qualitatively, a DREAD threat exercise can be a preliminary step for FAIR quantitative cyber risk analysis. The next step toward FAIR analysis would be to take those fairly high-level threats and break them down into loss event scenarios that represent the greatest potential harm to the organization and can be analyzed in terms of probable frequency of occurrence and magnitude of impact.
In the blog post Best Approach to Prioritizing Risks, FAIR creator Jack Jones describes using a simple spreadsheet to start breaking down threats by Confidentiality, Integrity and Availability, further categorizing them by assets and threat actor types, then using some critical thinking to focus in on the threats that are most likely to pose a risk to the organization.
For the next step, the video How to Turn Your Risk Register Items into Risk Scenarios You Can Quantify with FAIR shows how to use a who/what/where approach to create a set of concise loss event (or risk) scenarios with a threat actor impacting an asset resulting in an effect, such as
“Analyze the risk associated with a malicious privileged insider impacting the confidentiality of the PII contained in the Crown Jewel Database via a misuse of their access.”
Now an analyst has direction to find the data to fill in the factors for probable frequency and probable magnitude of loss, data quantifying, for instance the strength of the controls in place or the value of the PII. For maximum speed and practicality, an analyst feeds the data into a tool that runs many Monte Carlo simulations to calculate the range of loss exposure of the modeled risk scenarios. End result: a list of top risks prioritized quantitatively by probable loss exposure in dollar terms.

-squared-1.png)
.png)


